Today’s instrument is the Aveva Group Plc‘s stock traded on the LSE exchange under the ticker AVV.
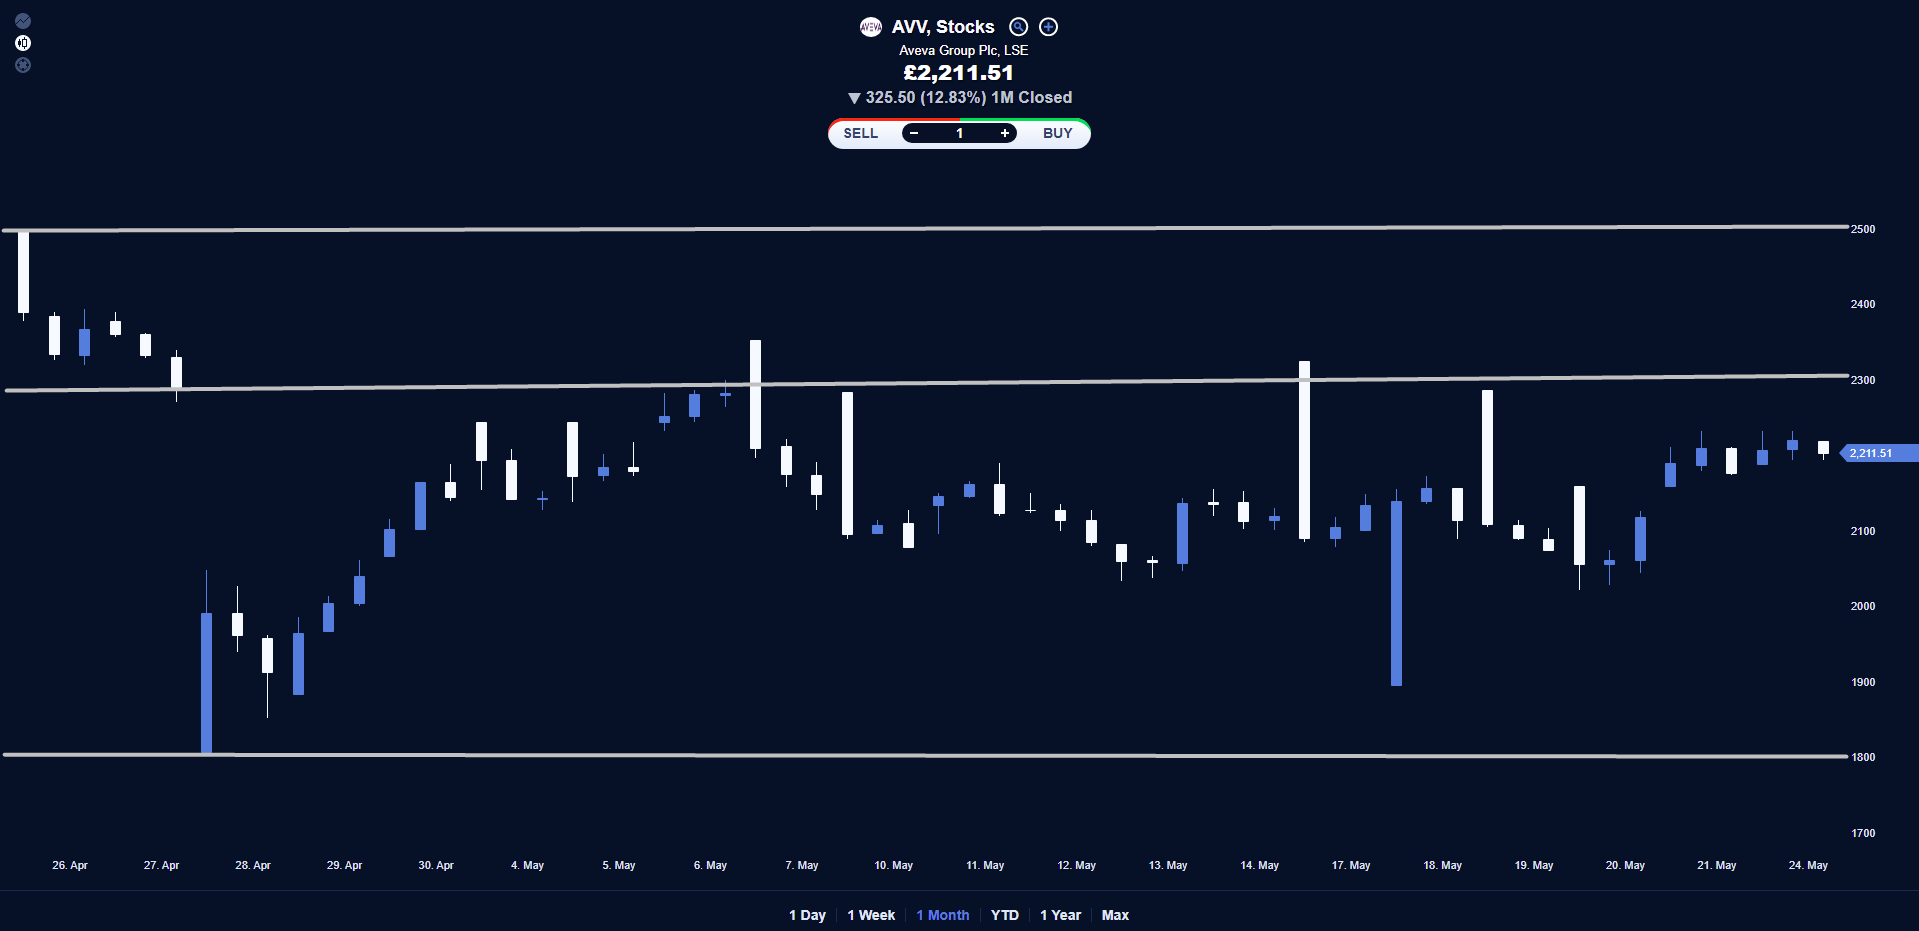
When we look at the AVV ‘s chart, we see its sharp fall from the £2500 from the to the £1800 range where it formed to support and bounced back to the £2200 range. Since then, it has been trading relatively steadily between £2400 overhead resistance and £1900 temporary support. It was last found trading at the £2211 level.
Today we can expect a move towards the £1900 temporary closest support level. If, however,
it manages to hold on to the current level then a move towards the £2300 can be expected.
Trading is risky. Information presented herein is not to be construed as a solicitation or an offer to buy or sell any Financial Instrument or to participate in any trading strategy. We also offer CFD products. 72.13% of retail CFD accounts lose money. CFDs trading is risky and your entire capital might be at risk. Information presented herein is not to be construed as a solicitation or an offer to buy or sell any Financial Instrument or to participate in any trading strategy.
Recommended content
Editors’ Picks
AUD/USD failed just ahead of the 200-day SMA
Finally, AUD/USD managed to break above the 0.6500 barrier on Wednesday, extending the weekly recovery, although its advance faltered just ahead of the 0.6530 region, where the key 200-day SMA sits.
EUR/USD met some decent resistance above 1.0700
EUR/USD remained unable to gather extra upside traction and surpass the 1.0700 hurdle in a convincing fashion on Wednesday, instead giving away part of the weekly gains against the backdrop of a decent bounce in the Dollar.
Gold keeps consolidating ahead of US first-tier figures
Gold finds it difficult to stage a rebound midweek following Monday's sharp decline but manages to hold above $2,300. The benchmark 10-year US Treasury bond yield stays in the green above 4.6% after US data, not allowing the pair to turn north.
Bitcoin price could be primed for correction as bearish activity grows near $66K area
Bitcoin (BTC) price managed to maintain a northbound trajectory after the April 20 halving, despite bold assertions by analysts that the event would be a “sell the news” situation. However, after four days of strength, the tables could be turning as a dark cloud now hovers above BTC price.
Bank of Japan's predicament: The BOJ is trapped
In this special edition of TradeGATEHub Live Trading, we're joined by guest speaker Tavi @TaviCosta, who shares his insights on the Bank of Japan's current predicament, stating, 'The BOJ is Trapped.'