Avery Dennison Corp.(AVY) Elliott Wave technical analysis [Video]
![Avery Dennison Corp.(AVY) Elliott Wave technical analysis [Video]](https://editorial.fxstreet.com/images/TechnicalAnalysis/ChartPatterns/PointFigure/hand-of-business-man-write-a-business-graph-59591884_XtraLarge.jpg)
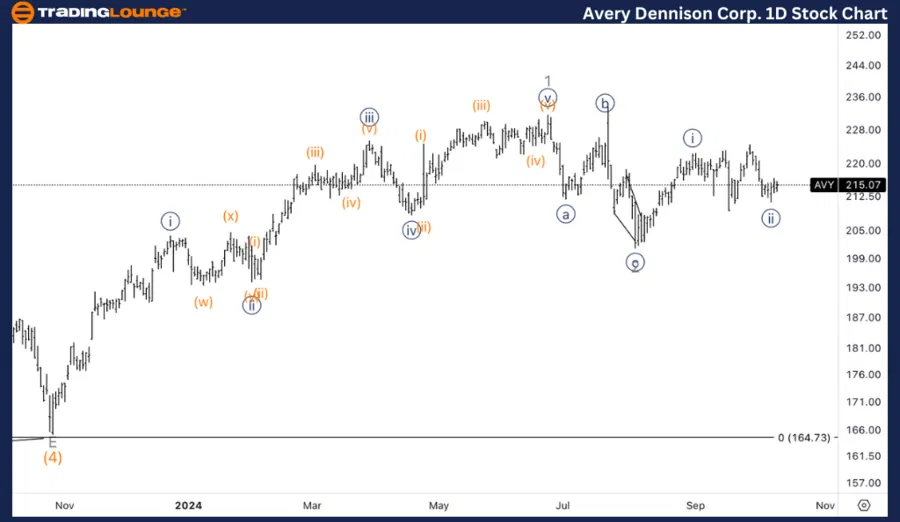
AVY Elliott Wave Analysis Trading Lounge daily chart.
AVY Elliott Wave technical analysis
Function: Trend.
Mode: Impulsive.
Structure: Motive.
Position: Wave 3.
Direction Upside in wave 3.
Details: We are looking at the possibility of a bottom in Minor wave 2 in place at 200$ and another {i}-{ii} of 3 completed, ready to take off.
AVY Elliott Wave technical analysis – Daily chart
On the daily chart, Avery Dennison (AVY) appears to have found a bottom in Minor wave 2 at $200. The stock is now set to move higher, with an initial {i}-{ii} of wave 3 completed. This setup indicates the stock is poised for a significant upside in wave 3, suggesting a potential strong rally ahead as wave 3 is often the most powerful in an impulsive structure.
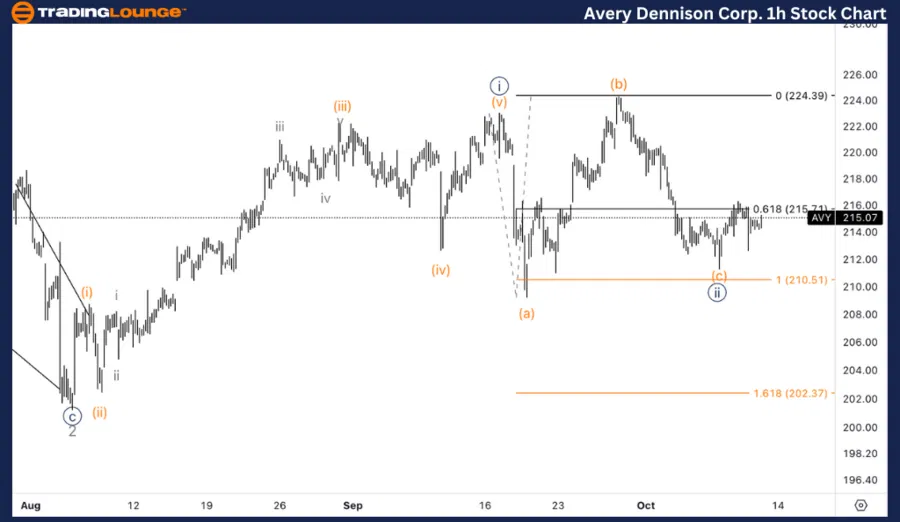
Avery Dennison Corp., (AVY) one-hour chart.
AVY Elliott Wave technical analysis
FUNCTION: Trend
MODE: Impulsive
STRUCTURE: Motive
POSITION: Wave {ii}
DIRECTION: Bottom in wave {ii}
DETAILS: Looking for upside in wave {iii} as we have reached equality of (c) vs. (a) within {ii}, we now need support on top of 220$.
AVY Elliott Wave technical analysis – One-hour chart
On the 1-hour chart, AVY has likely completed wave {ii}, as it reached equality of (c) vs (a). The stock is expected to start a strong upward move in wave {iii}. For the bullish scenario to play out, support above $220 is crucial. Holding this level would confirm the upside continuation into wave {iii}.
This analysis of Avery Dennison Corp., (AVY) focuses on both the daily and 1-hour charts, using the Elliott Wave Theory to assess current market trends and forecast future price movements.
Avery Dennison Corp.(AVY) Elliott Wave technical analysis [Video]
Author

Peter Mathers
TradingLounge
Peter Mathers started actively trading in 1982. He began his career at Hoei and Shoin, a Japanese futures trading company.


