AUD/USD trades sideways as fundamental and technical factors weigh on price action
- AUD/USD whipsaws on mixed economic data and expectations for monetary policy.
- Australia’s Retail Sales miss forecasts, but declining US inflation limits the losses.
- AUD/USD looks toward technical levels from historical moves for direction.

The Australian Dollar (AUD) is consolidating against the US Dollar on Friday as fresh domestic data and monetary policy expectations for the Reserve Bank of Australia (RBA) and the US Federal Reserve (Fed) continue to drive price action.
At the time of writing, the AUD/USD pair is struggling to find direction, held back by a combination of soft economic fundamentals and a technically capped range.
Australia’s economy shows signs of weakness as US inflation softens
Australia's economic data releases on Friday came in weaker than expected across key sectors. Building Permits dropped 5.7% MoM in April, a sharper-than-expected fall that extends March’s revised 7.1% decline.
Retail Sales also slipped by 0.1%, missing forecasts for a 0.3% gain. While private sector credit picked up marginally, the broader takeaway is that demand remains soft and the recovery uneven.
Meanwhile, the US economy continues to show signs of resiliency. Friday's data confirmed that core Personal Consumption Expenditure (PCE) inflation remained stable at 0.1% MoM in April, with YoY figures moderating from 2.7% to 2.5%.
The goods trade deficit narrowed significantly to -$87.62 billion, and Michigan Consumer Sentiment climbed to 52.2, its highest level since January.
These data points reinforce the diverging monetary policy paths, with the Fed remaining in a “wait-and-see” mode, showing no urgency to cut, while the RBA appears increasingly cornered into easing.
AUD/USD technical levels form a firm range of confluency, raising the potential for a breakout
Despite the bearish macro backdrop, AUD/USD remains rangebound and technically indecisive. The pair is currently hovering around 0.6440, stuck just below the 61.8% retracement level of the 2020-2021 rally, holding at 0.6464.
AUD/USD daily chart
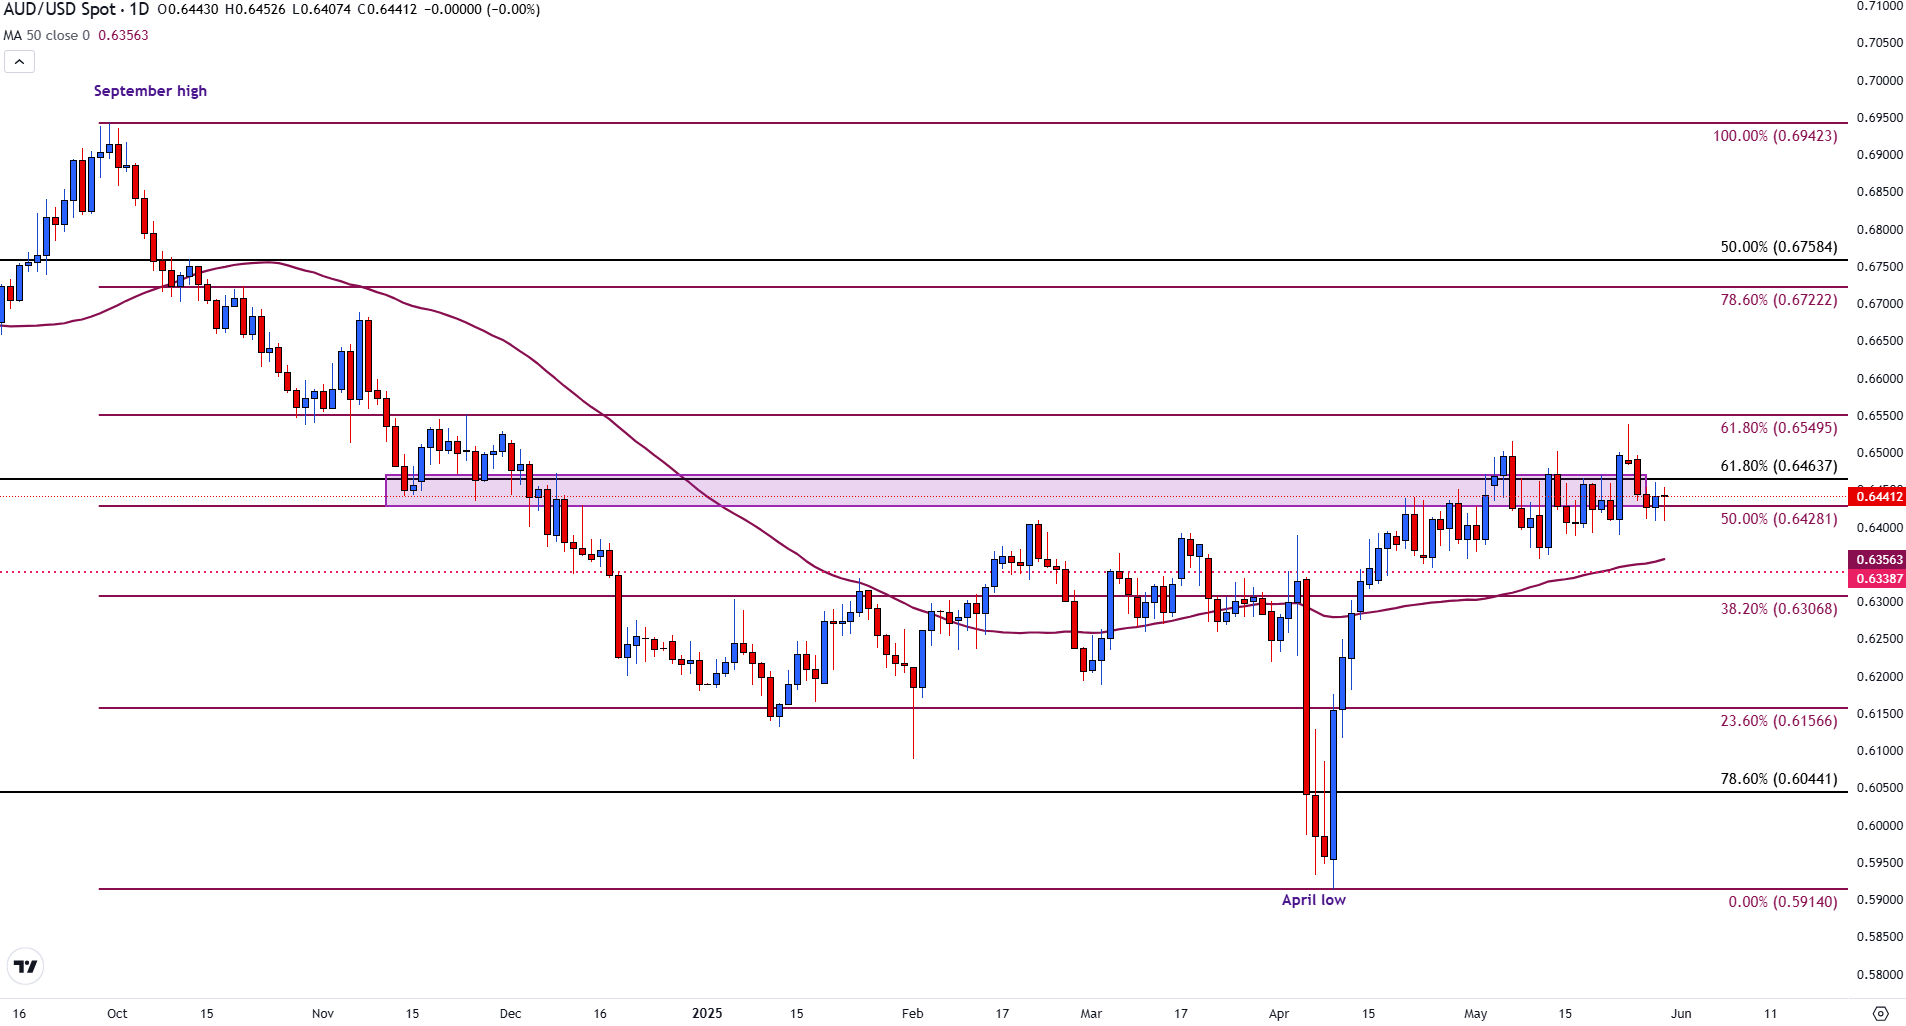
Over the past month, the pair has failed to sustain momentum above 0.6549, while also finding support just above the mid-point of the September to April decline at 0.6428. The 50-day Simple Moving Average (SMA), now rising toward 0.6356, offers nearby dynamic support should bearish pressure resume.
A break below 0.6428 would increase downside risk toward the 0.6338 zone and potentially 0.6307 (the 38.2% Fibonacci of the September-April move). On the upside, a close above 0.6463 would be required to challenge the top of the range and potentially test 0.6550 again.
Australian Dollar FAQs
One of the most significant factors for the Australian Dollar (AUD) is the level of interest rates set by the Reserve Bank of Australia (RBA). Because Australia is a resource-rich country another key driver is the price of its biggest export, Iron Ore. The health of the Chinese economy, its largest trading partner, is a factor, as well as inflation in Australia, its growth rate and Trade Balance. Market sentiment – whether investors are taking on more risky assets (risk-on) or seeking safe-havens (risk-off) – is also a factor, with risk-on positive for AUD.
The Reserve Bank of Australia (RBA) influences the Australian Dollar (AUD) by setting the level of interest rates that Australian banks can lend to each other. This influences the level of interest rates in the economy as a whole. The main goal of the RBA is to maintain a stable inflation rate of 2-3% by adjusting interest rates up or down. Relatively high interest rates compared to other major central banks support the AUD, and the opposite for relatively low. The RBA can also use quantitative easing and tightening to influence credit conditions, with the former AUD-negative and the latter AUD-positive.
China is Australia’s largest trading partner so the health of the Chinese economy is a major influence on the value of the Australian Dollar (AUD). When the Chinese economy is doing well it purchases more raw materials, goods and services from Australia, lifting demand for the AUD, and pushing up its value. The opposite is the case when the Chinese economy is not growing as fast as expected. Positive or negative surprises in Chinese growth data, therefore, often have a direct impact on the Australian Dollar and its pairs.
Iron Ore is Australia’s largest export, accounting for $118 billion a year according to data from 2021, with China as its primary destination. The price of Iron Ore, therefore, can be a driver of the Australian Dollar. Generally, if the price of Iron Ore rises, AUD also goes up, as aggregate demand for the currency increases. The opposite is the case if the price of Iron Ore falls. Higher Iron Ore prices also tend to result in a greater likelihood of a positive Trade Balance for Australia, which is also positive of the AUD.
The Trade Balance, which is the difference between what a country earns from its exports versus what it pays for its imports, is another factor that can influence the value of the Australian Dollar. If Australia produces highly sought after exports, then its currency will gain in value purely from the surplus demand created from foreign buyers seeking to purchase its exports versus what it spends to purchase imports. Therefore, a positive net Trade Balance strengthens the AUD, with the opposite effect if the Trade Balance is negative.
Author

Tammy Da Costa, CFTe®
FXStreet
Tammy is an economist and market analyst with a deep passion for financial markets, particularly commodities and geopolitics.
















