|
AUD/USD technical analysis: Aussie spikes to 6-day high above 0.6900 on USD weakness
- AUD/USD is recovering after seeing intense selling in the last weeks.
- The level to beat for bulls is at 0.6930 resistance according to the Technical Confluences Indicator.

The US Dollar is weakening across the board on the back of dovish comments from the Fed.
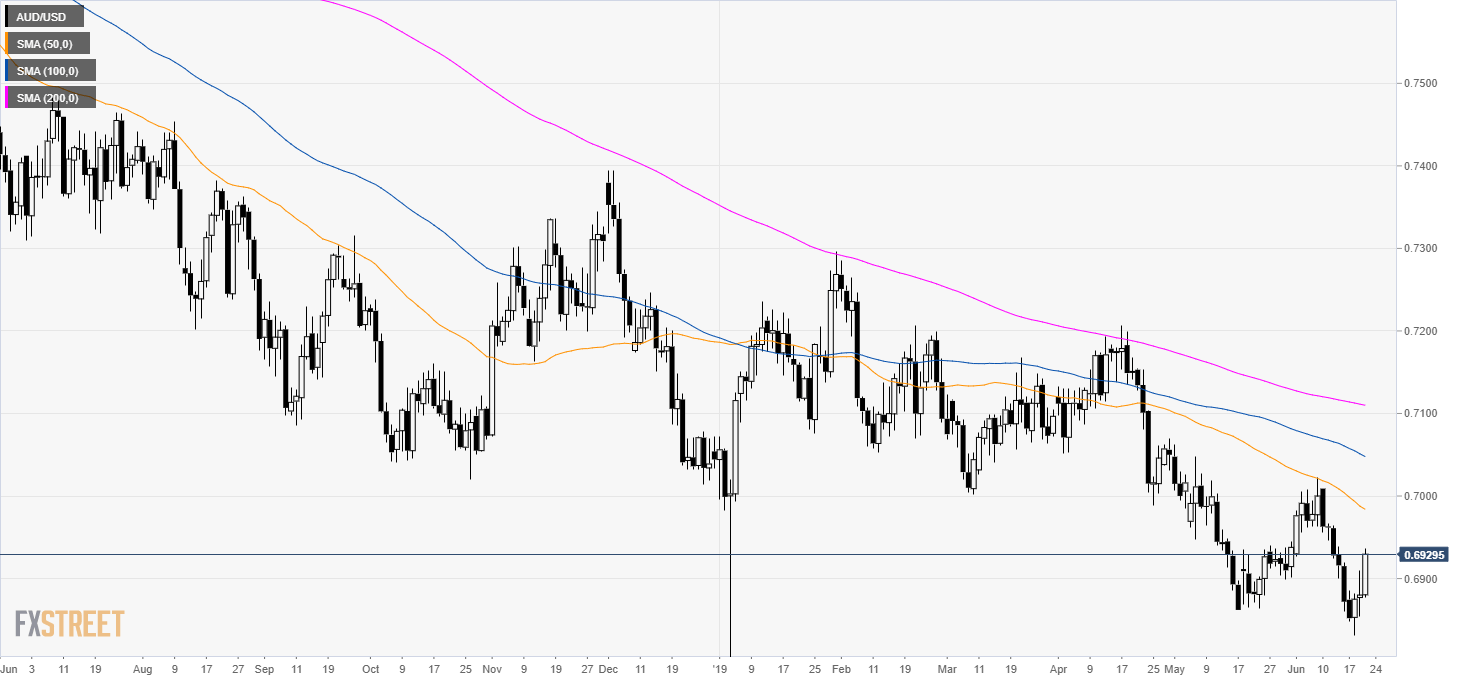
AUD/USD daily chart
AUD/USD is trading in a bear trend below its main daily simple moving averages (DSMAs). The market is rebounding sharply above the 0.6900 figure.
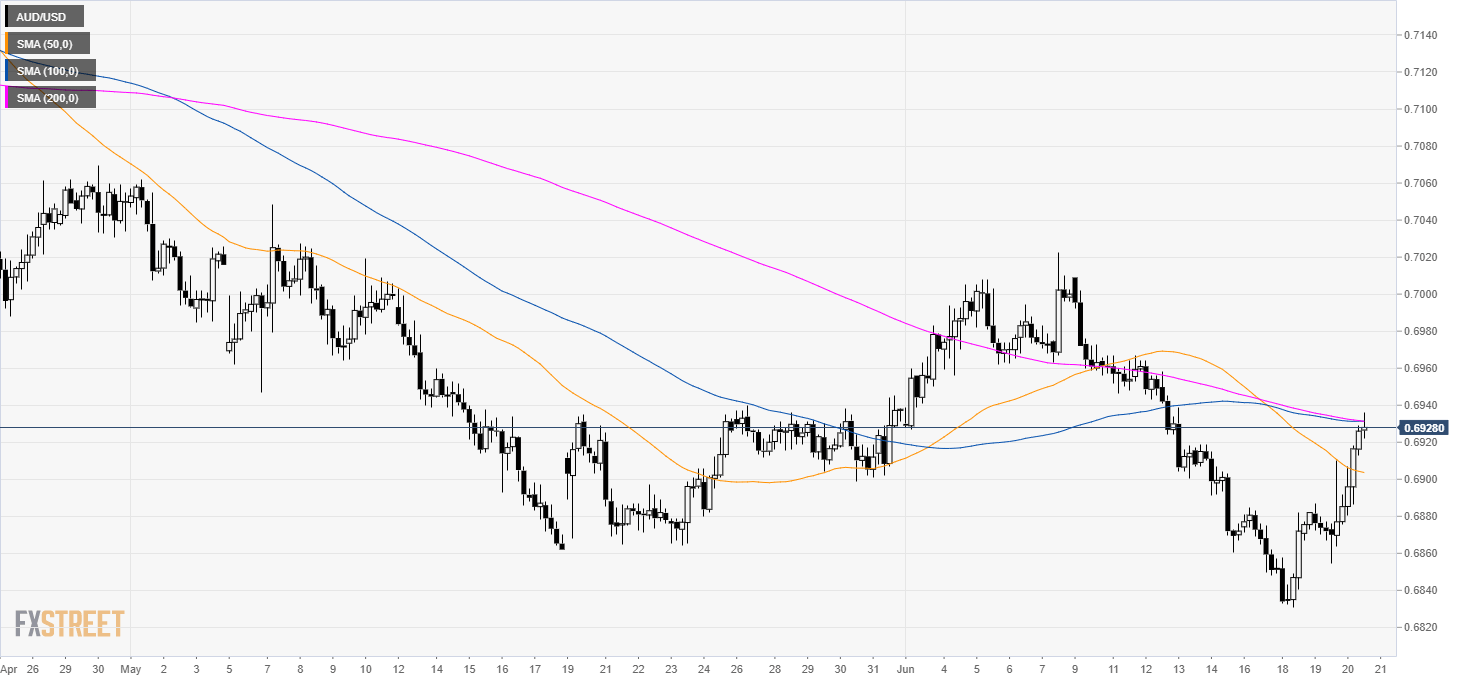
AUD/USD 4-hour chart
The Aussie made a sharp recovery as it now challenging the 100 and 200 SMAs near 0.6939 resistance which is a cluster of technical levels according to the Technical Confluences Indicator.

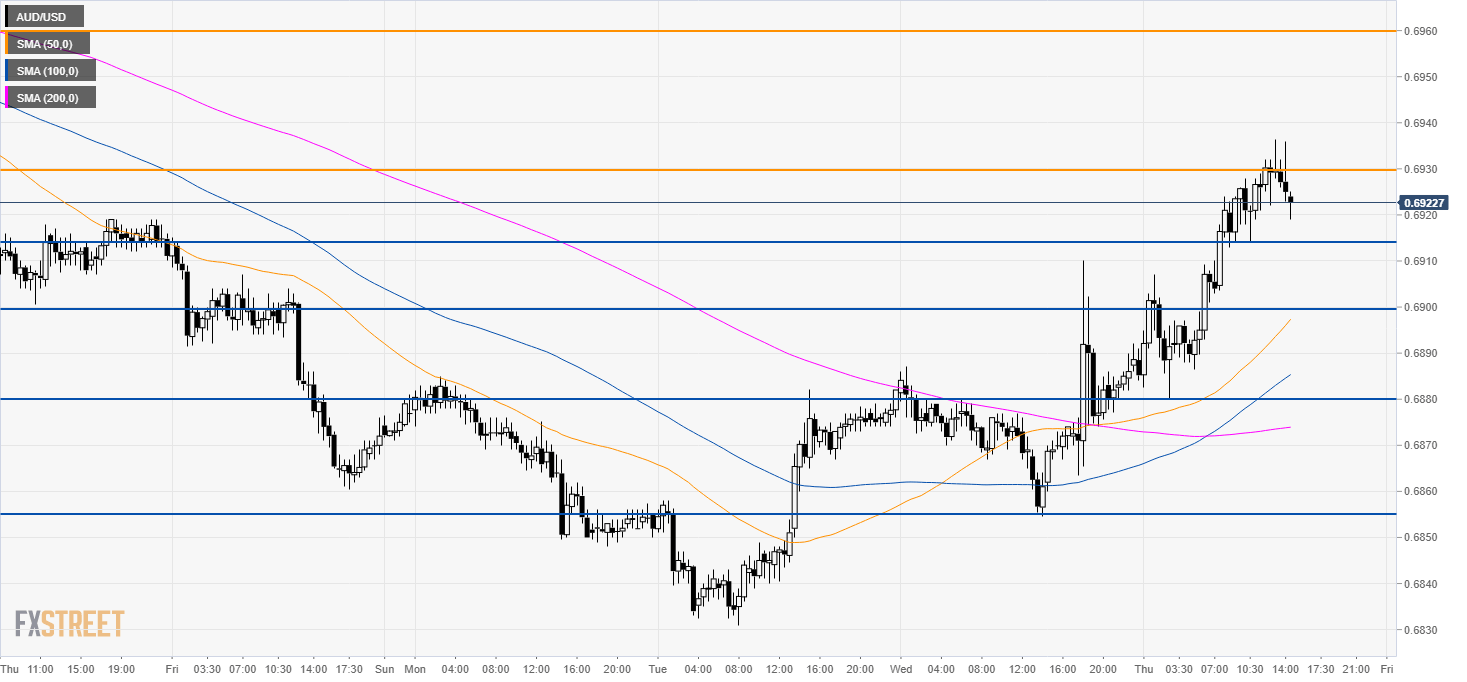
AUD/USD 30-minute chart
AUD/USD is trading above its main SMAs suggesting bullish momentum in the near term. A sustained break above 0.6930 can send the Aussie to 0.6960, the next main resistance according to the Technical Confluences Indicator. Support is at 0.6915 and 0.6900 figure.
Additional key levels
Author

Flavio Tosti
Independent Analyst
More from Flavio Tosti


