|

AUD/USD Technical Analysis: Aussie dips to 0.7100 figure

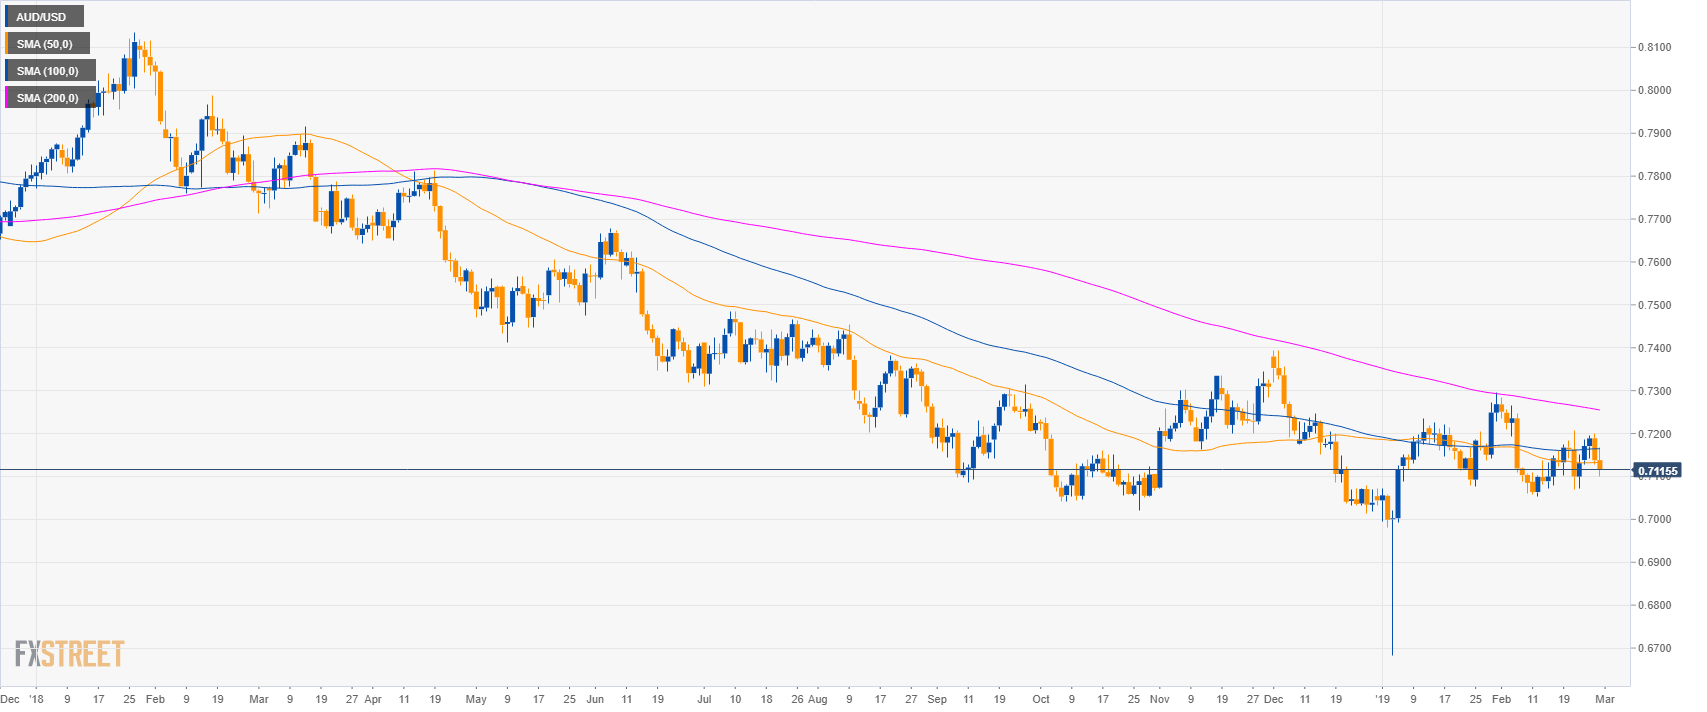
AUD/USD daily chart

  • AUD/USD is trading below its main simple moving average suggesting bearish momentum.
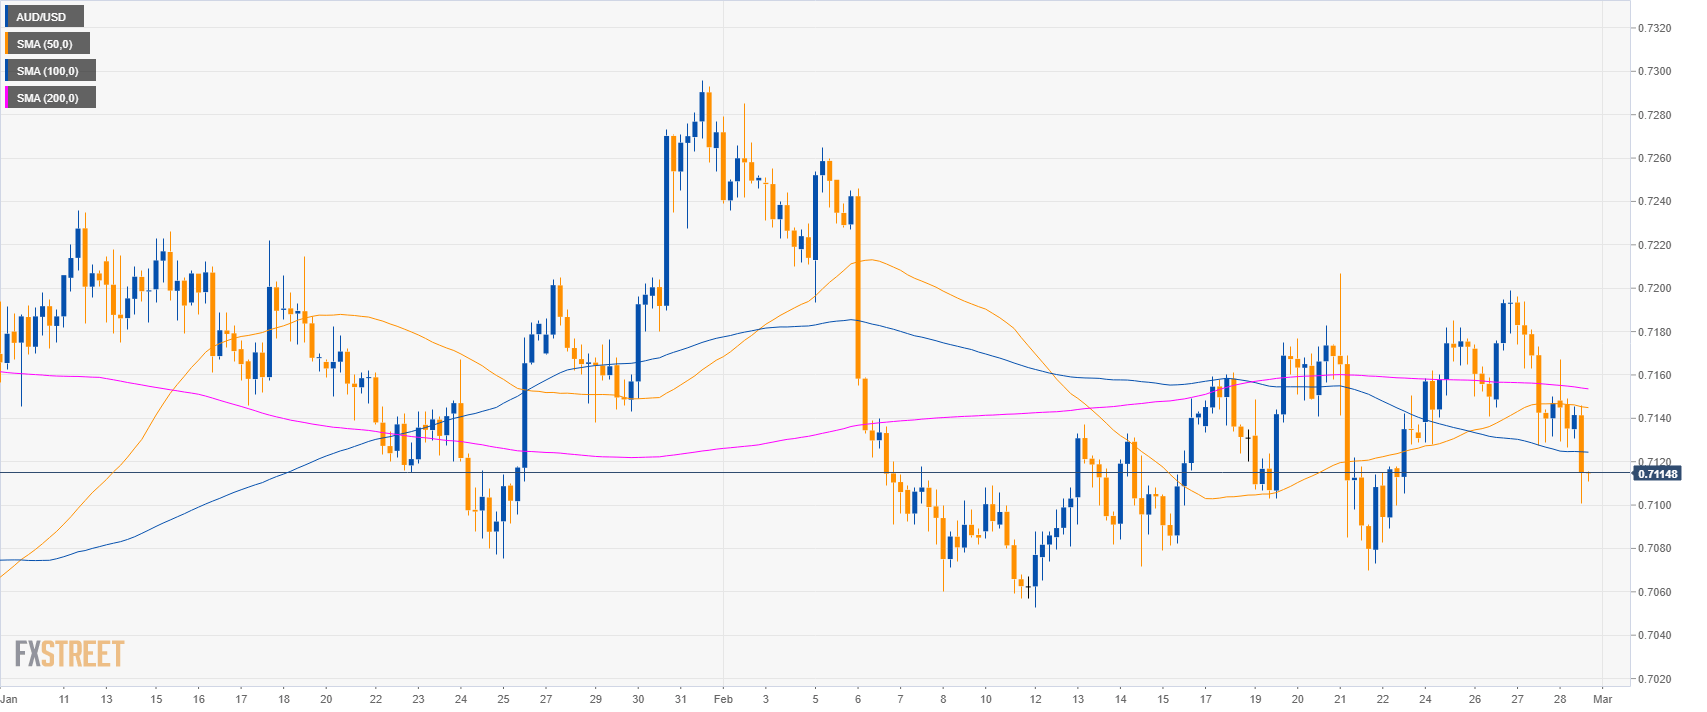
AUD/USD 4-hour chart

  • AUD/USD is trading below its main SMAs suggesting bearish momentum in the medium-term.
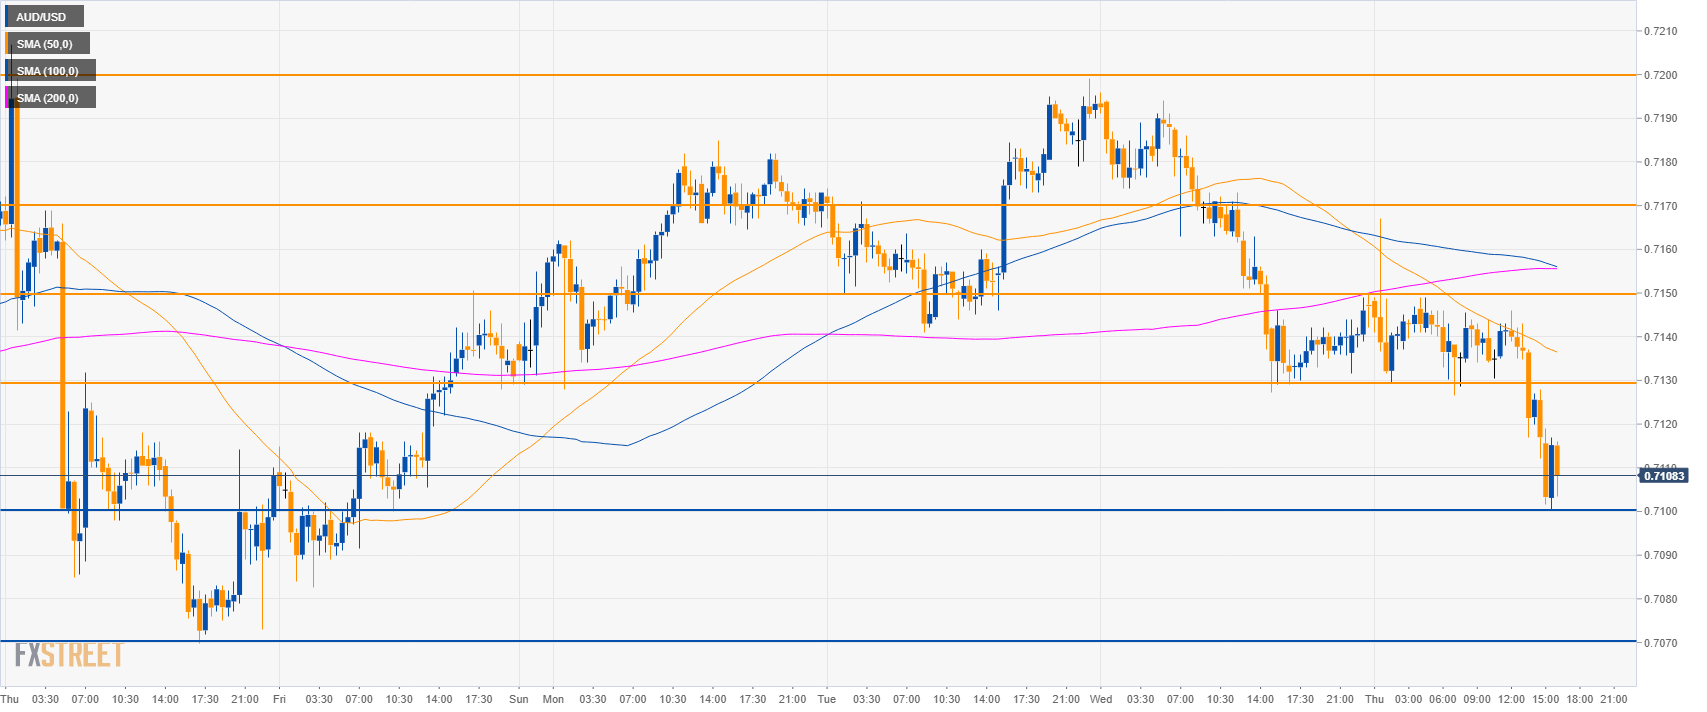
AUD/USD 30-minute chart

  • AUD/USD is trading below the main SMAs suggesting bearish momentum in the short-term.
  • A break below 0.7100 on a daily closing basis would open the gates to 0.7030 support. 
  • On the way up resistances are at 0.7130, 0.7150 and 0.7200 level.

Additional key levels 

AUD/USD

Overview:
    Today Last Price: 0.7115
    Today Daily change: -23 pips
    Today Daily change %: -0.32%
    Today Daily Open: 0.7138
Trends:
    Daily SMA20: 0.7149
    Daily SMA50: 0.7133
    Daily SMA100: 0.7165
    Daily SMA200: 0.7257
Levels:
    Previous Daily High: 0.7199
    Previous Daily Low: 0.7127
    Previous Weekly High: 0.7207
    Previous Weekly Low: 0.707
    Previous Monthly High: 0.7296
    Previous Monthly Low: 0.6684
    Daily Fibonacci 38.2%: 0.7155
    Daily Fibonacci 61.8%: 0.7172
    Daily Pivot Point S1: 0.711
    Daily Pivot Point S2: 0.7083
    Daily Pivot Point S3: 0.7039
    Daily Pivot Point R1: 0.7182
    Daily Pivot Point R2: 0.7226
    Daily Pivot Point R3: 0.7254

Author

Flavio Tosti

Flavio Tosti

Independent Analyst

 

More from Flavio Tosti
Share:

Editor's Picks

GBP/USD off highs, back to 1.3620

GBP/USD remains slightly on the defensive at the end of the week, receding to the low 1.3600s after hitting fresh tops past 1.3670 earlier in the day. Cable’s correction comes after two daily gains in a row and amid a tepid advance in the Greenback, while poor UK data also accompany the downside.

EUR/USD treads water below 1.1700

EUR/USD now trades with modest losses around 1.1670 following another unsuccessful atempt to advance past 1.1700 the figure in a convincing fashion. The pair’s decline follows a maginal rebound in the US Dollar as market participants continue to assess recent US data as well as developments from the US bond market.

Gold trims gains, recedes to the sub-$4,600 area

Gold rapidly leaves behind Thursday’s inconclusive price action and advances markedly on Friday, briefly surpassing the $4,600 mark per troy ounce to hit three-month peaks. Meanwhile, the precious metal’s solid performance comes despite marginal gains in the buck coupled with another day of rising US Treasury yields across the curve.

Crypto Today: Bitcoin, Ethereum, XRP bulls accelerate rally amid rising ETF inflows

The cryptocurrency market remains bullish on Friday, led by Bitcoin’s surge above $77,000. Altcoins, including Ethereum and Ripple, mirror BTC’s positive outlook, trading near $2,400 and $1.35, respectively.

Week ahead – Fed’s Jackson Hole and Nvidia earnings to dictate markets

Kevin Warsh to make his Jackson Hole debut amid confusing messaging. But a major hawkish surprise unlikely after bond market intervention. Nvidia earnings to also determine market direction as stock rally cools.

$20 billion offered, $2 billion taken: Why Treasury doubled its buyback cap

The US Treasury moved off its own calendar on Wednesday, and that is the part worth sitting with. At 12:32 GMT, the department said it would at least double the size of liquidity support buyback operations in the 10-year to 20-year and 20-year to 30-year sectors, lifting the maximum from $2 billion per operation to at least $4 billion, effective September 9 and running to November 4.