|

AUD/USD takes a break during its uptrend

  • AUD/USD is taking a breather after a strong rally. 
  • It is biased to continue rising in line with the trend once the consolidation ends.
  • The RSI is overbought but has not yet given a sell signal. 
     

AUD/USD has established a sequence of rising peaks and troughs on the 4-hour chart since it recovered from the August 5 lows. The sequence of higher highs and lows is indicative of a short-term uptrend, which given “the trend is your friend” is biased to continue. 

AUD/USD 4-hour Chart


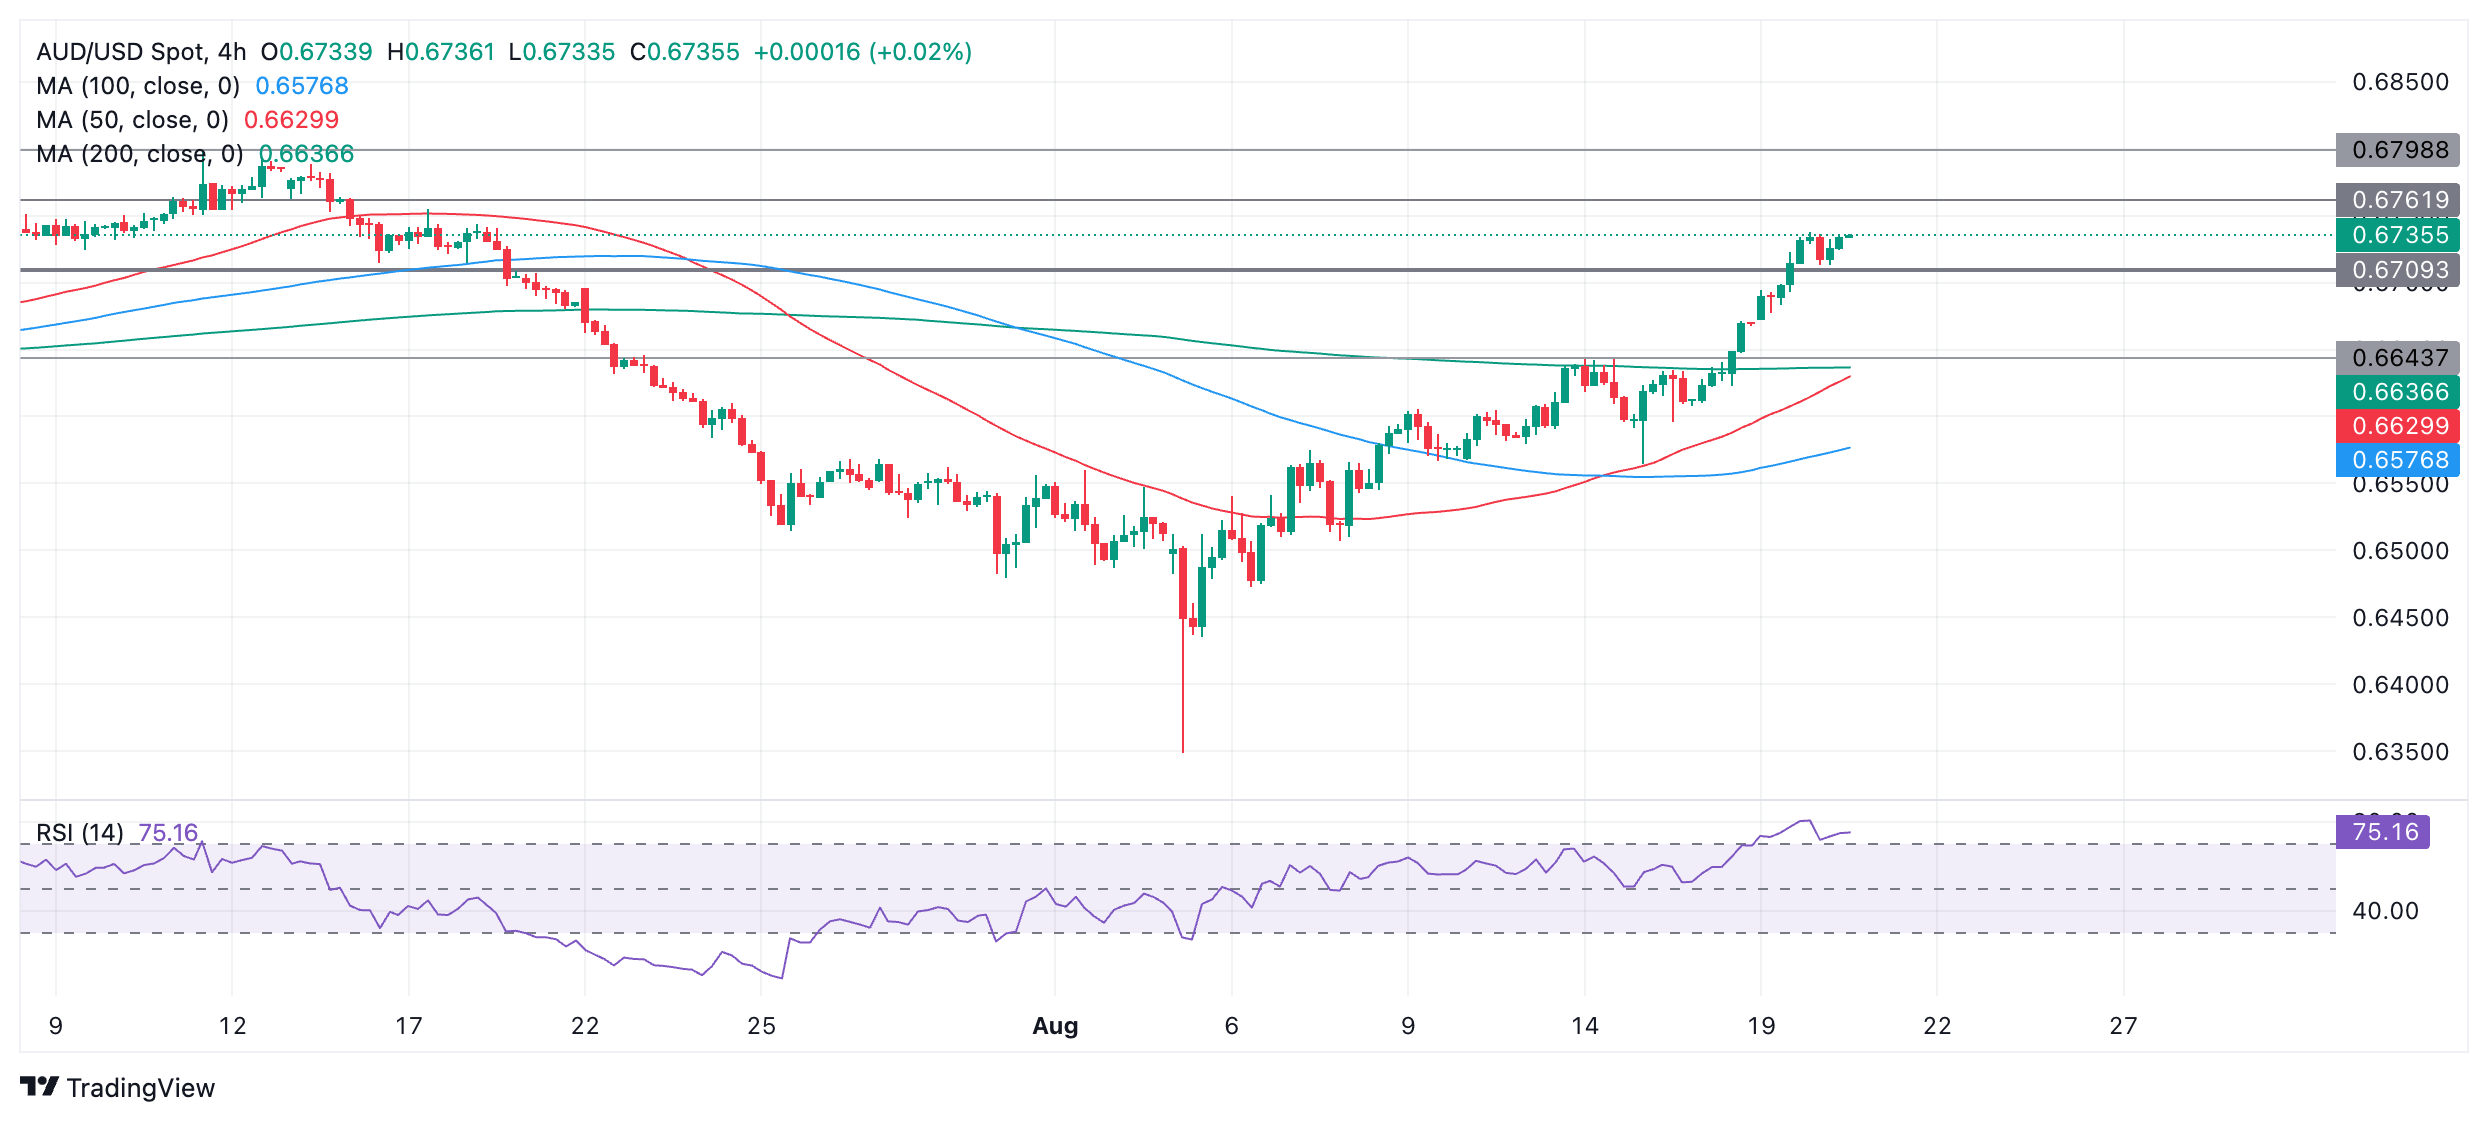
The pair has stalled over the last few periods and started to trade sideways in the 0.6730s. A close above 0.6740, however, would probably indicate the start of a continuation higher. 

Further resistance lies at 0.6760 followed by 0.6799, the July 11 high. 

The Relative Strength Index (RSI) is in overbought territory, increasing the chances of a pull back. For confirmation of a correction in price, however, the RSI would have to exit overbought and re-enter neutral territory. 

Despite the overbought RSI, AUD/USD could still go higher, although long holders are not advised to add to their existing positions whilst RSI remains above 70. 

Author

Joaquin Monfort

Joaquin Monfort is a financial writer and analyst with over 10 years experience writing about financial markets and alt data. He holds a degree in Anthropology from London University and a Diploma in Technical analysis.

More from Joaquin Monfort
Share:

Editor's Picks

EUR/USD trims gains, hovers around 1.1900 post-US data

EUR/USD trades slightly on the back foot around the 1.1900 region in a context dominated by the resurgence of some buying interest around the US Dollar on turnaround Tuesday. Looking at the US docket, Retail Sales disappointed expectations in December, while the ADP 4-Week Average came in at 6.5K.

GBP/USD comes under pressure near 1.3680

The better tone in the Greenback hurts the risk-linked complex on Tuesday, prompting GBP/USD to set aside two consecutive days of gains and trade slightly on the defensive below the 1.3700 mark. Investors, in the meantime, keep their attention on key UK data due later in the week.

Gold loses some traction, still above $5,000

Gold faces some selling pressure on Tuesday, surrendering part of its recent two-day advance although managing to keep the trade above the $5,000 mark per troy ounce. The daily pullback in the precious metal comes in response to the modest rebound in the US Dollar, while declining US Treasury yields across the curve seem to limit the downside.

XRP holds $1.40 amid ETF inflows and stable derivatives market

Ripple trades under pressure, with immediate support at $1.40 holding at the time of writing on Tuesday. A recovery attempt from last week’s sell-off to $1.12 stalled at $1.54 on Friday, leading to limited price action between the current support and the resistance.

Dollar drops and stocks rally: The week of reckoning for US economic data

Following a sizeable move lower in US technology Stocks last week, we have witnessed a meaningful recovery unfold. The USD Index is in a concerning position; the monthly price continues to hold the south channel support.

XRP holds $1.40 amid ETF inflows and stable derivatives market

Ripple trades under pressure, with immediate support at $1.40 holding at the time of writing on Tuesday. A recovery attempt from last week’s sell-off to $1.12 stalled at $1.54 on Friday, leading to limited price action between the current support and the resistance.