AUD/USD soars to YTD high as DXY slumps despite solid US jobs report
- US NFP beats at 177K, but Fed seen delivering only three cuts instead of four.
- DXY drops 0.58% to 99.59, fueling demand for risk-sensitive currencies like the Aussie.
- Traders favor AUD as risk appetite improves and US policy outlook remains data-dependent.

The Australian Dollar surged to a new year-to-date (YTD) high of 0.6469, gaining over 1.20% following a strong jobs report in the United States (US) that suggested the economy remains solid.
AUD/USD jumps 1.20% to 0.6469 as Dollar weakens on shifting Fed rate cut bets and upbeat risk sentiment
Nonfarm Payroll figures in April rose by 177K, up from 130K projected, and trailed March’s downward revised 185K numbers. The Unemployment Rate was unchanged as expected at 4.2% and reaffirms the Federal Reserve’s (Fed) posture of waiting for the hard data to dictate monetary policy.
Hence, traders who expected four rate cuts according to the Fed Funds rates futures now expect three.
Despite the strong data, the Aussie Dollar is also rising as the US Dollar Index (DXY) tumbles. The DXY who tracks the performance of the American Dollar against a basket of six peers, is down 0.58% at 99.59.
AUD/USD Price Chart – Daily
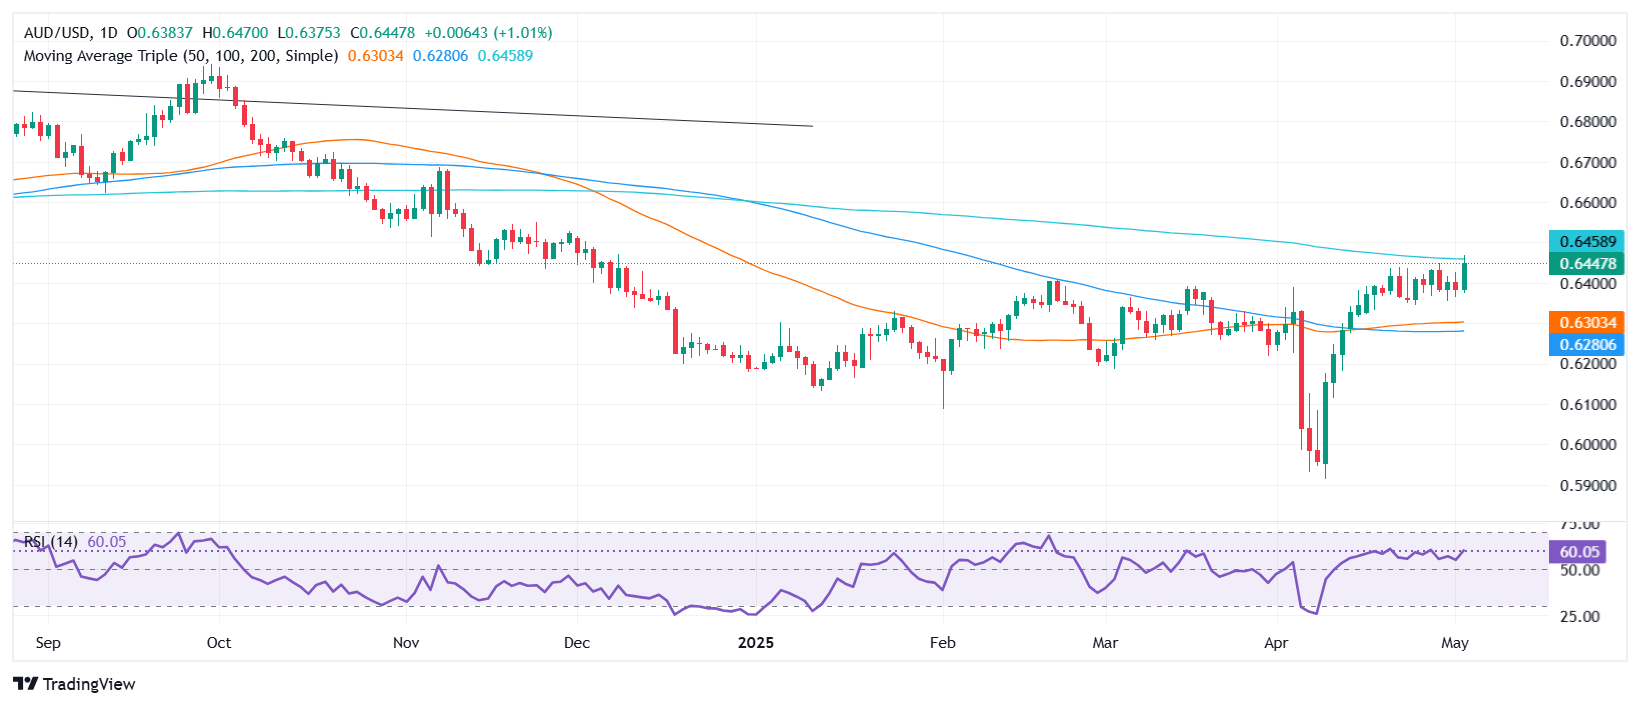
Although hitting new yearly highs, traders should know that the 200-day Simple Moving Average (SMA) at 0.6461 is the first resistance level. A decisive break will expose the 0.6500 figure and the November 25 peak at 0.6549. Failure at the 200-day SMA would exacerbate a pullback toward 0.6400 and lower the exchange rate.
Australian Dollar PRICE This year
The table below shows the percentage change of Australian Dollar (AUD) against listed major currencies this year. Australian Dollar was the strongest against the US Dollar.
| USD | EUR | GBP | JPY | CAD | AUD | NZD | CHF | |
|---|---|---|---|---|---|---|---|---|
| USD | -8.65% | -5.84% | -8.24% | -4.16% | -3.99% | -6.08% | -9.02% | |
| EUR | 8.65% | 3.13% | 0.54% | 5.00% | 5.14% | 2.90% | -0.32% | |
| GBP | 5.84% | -3.13% | -2.50% | 1.83% | 1.95% | -0.22% | -3.34% | |
| JPY | 8.24% | -0.54% | 2.50% | 4.45% | 4.65% | 2.38% | -0.82% | |
| CAD | 4.16% | -5.00% | -1.83% | -4.45% | 0.07% | -2.02% | -5.08% | |
| AUD | 3.99% | -5.14% | -1.95% | -4.65% | -0.07% | -2.12% | -5.17% | |
| NZD | 6.08% | -2.90% | 0.22% | -2.38% | 2.02% | 2.12% | -3.13% | |
| CHF | 9.02% | 0.32% | 3.34% | 0.82% | 5.08% | 5.17% | 3.13% |
The heat map shows percentage changes of major currencies against each other. The base currency is picked from the left column, while the quote currency is picked from the top row. For example, if you pick the Australian Dollar from the left column and move along the horizontal line to the US Dollar, the percentage change displayed in the box will represent AUD (base)/USD (quote).
Author

Christian Borjon Valencia
FXStreet
Markets analyst, news editor, and trading instructor with over 14 years of experience across FX, commodities, US equity indices, and global macro markets.


