AUD/USD Price Forecast: Wobbles around 200-day EMA near 0.6400 for almost two weeks
- AUD/USD climbs to near 0.6430 as the US Dollar faces pressure despite easing US-China trade tensions.
- Investors await the US NFP data, which will influence the Federal Reserve’s (Fed) monetary policy outlook.
- The Aussie pair trades sideways around 0.6400 for almost two weeks.

The AUD/USD pair jumps to near 0.6430 on Friday. The Aussie pair strengthens as the US Dollar (USD) corrects sharply, even as hopes of a de-escalation in the trade war between the United States (US) and China have improved.
The confidence of investors that trade tensions between the world’s two largest powerhouses have increased after comments from the Chinese Commerce Ministry indicated that Beijing is open to trade talks but wants the US to show “sincerity”.
Easing US-China trade tensions is favorable for the Australian Dollar (AUD), given that Australia is the leading trading partner of Beijing.
The US Dollar Index (DXY), which tracks the Greenback’s value against six major currencies, falls sharply to near 99.75.
Meanwhile, investors await the US Nonfarm Payrolls (NFP) data for April, which will be published at 12:30 GMT. The US NFP is expected to show that the economy added 130K fresh workers, significantly lower than the March reading of 228K.
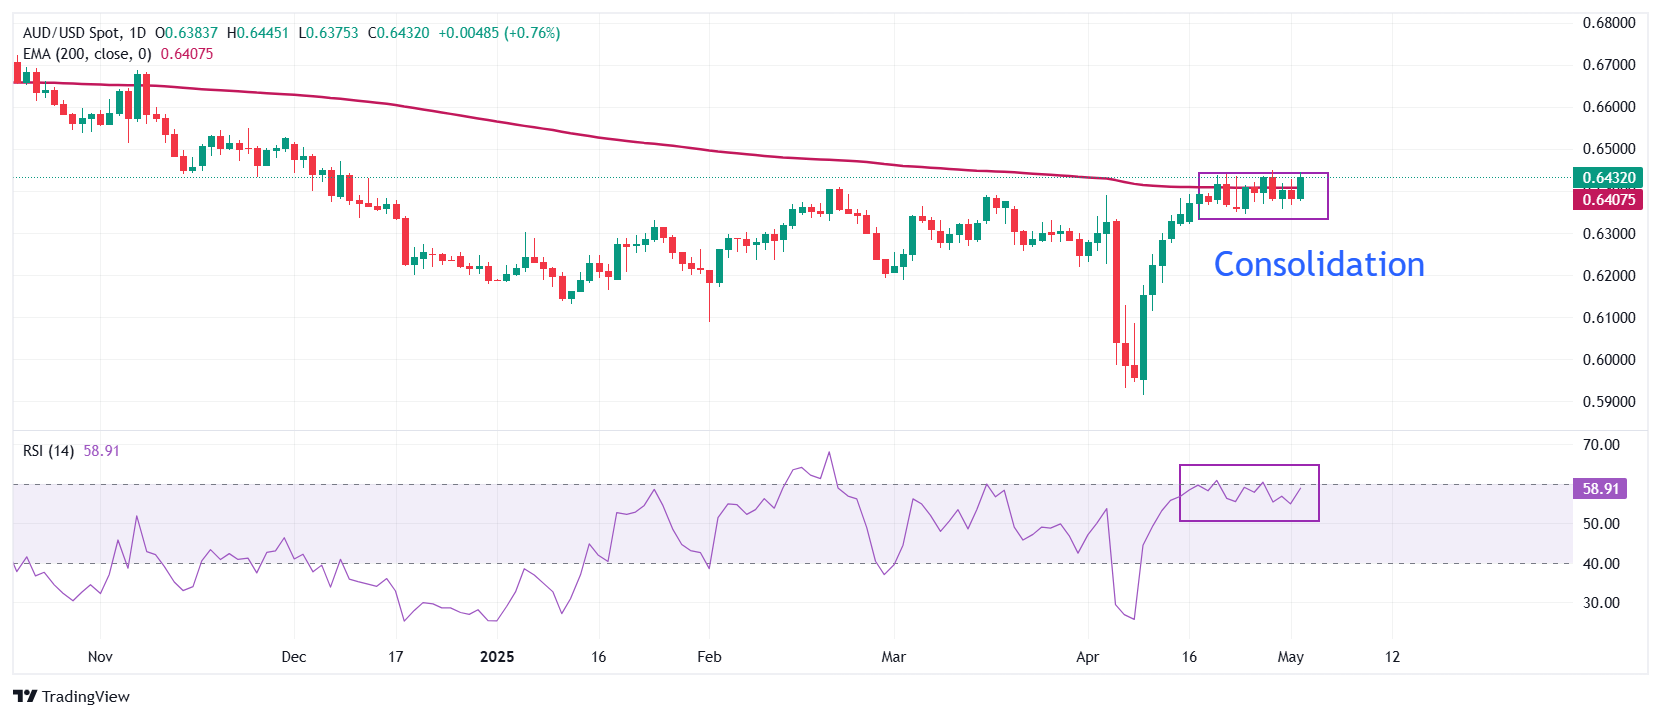
AUD/USD consolidates in a tight range of 0.6340-0.6450 for almost two weeks. The pair wobbles near the 200-day Exponential Moving Average (EMA) around 0.6407, indicating a sideways trend.
The 14-day Relative Strength Index (RSI) oscillates around 60.00. A fresh bullish momentum would emerge if the RSI breaks above that level.
More upside would appear towards the round-level resistance of 0.6500 and the November 25 high of 0.6550 if the pair if the pair breaks above the December 5 high of 0.6456.
On the flip side, a downside move below the March 4 low of 0.6187 towards the February low of 0.6087, followed by the psychological support of 0.6000.
AUD/USD daily chart
US-China Trade War FAQs
Generally speaking, a trade war is an economic conflict between two or more countries due to extreme protectionism on one end. It implies the creation of trade barriers, such as tariffs, which result in counter-barriers, escalating import costs, and hence the cost of living.
An economic conflict between the United States (US) and China began early in 2018, when President Donald Trump set trade barriers on China, claiming unfair commercial practices and intellectual property theft from the Asian giant. China took retaliatory action, imposing tariffs on multiple US goods, such as automobiles and soybeans. Tensions escalated until the two countries signed the US-China Phase One trade deal in January 2020. The agreement required structural reforms and other changes to China’s economic and trade regime and pretended to restore stability and trust between the two nations. However, the Coronavirus pandemic took the focus out of the conflict. Yet, it is worth mentioning that President Joe Biden, who took office after Trump, kept tariffs in place and even added some additional levies.
The return of Donald Trump to the White House as the 47th US President has sparked a fresh wave of tensions between the two countries. During the 2024 election campaign, Trump pledged to impose 60% tariffs on China once he returned to office, which he did on January 20, 2025. With Trump back, the US-China trade war is meant to resume where it was left, with tit-for-tat policies affecting the global economic landscape amid disruptions in global supply chains, resulting in a reduction in spending, particularly investment, and directly feeding into the Consumer Price Index inflation.
Author

Sagar Dua
FXStreet
Sagar Dua is associated with the financial markets from his college days. Along with pursuing post-graduation in Commerce in 2014, he started his markets training with chart analysis.


