AUD/USD Price Forecast: Slips below 0.66 on US Dollar strength
- AUD/USD drops 0.31% after two-week high, pressured by renewed US Dollar strength.
- RSI momentum favors bears, with support near 200-day SMA if downside extends.
- Traders eye Fed tone and US data as optimism for RBA tightening fades.

The AUD/USD ended Thursday session with losses of 0.31%, beneath the 0.6600 figure after reaching a two-week high of 0.6617 following a red-hot inflation report two days ago that increased the chances that the Reserve Bank of Australia (RBA) would likely keep rates unchanged. At the time of writing, the pair trades at 0.6552 as Friday’s Asian session begins.
AUD/USD Price Forecast: Technical Outlook
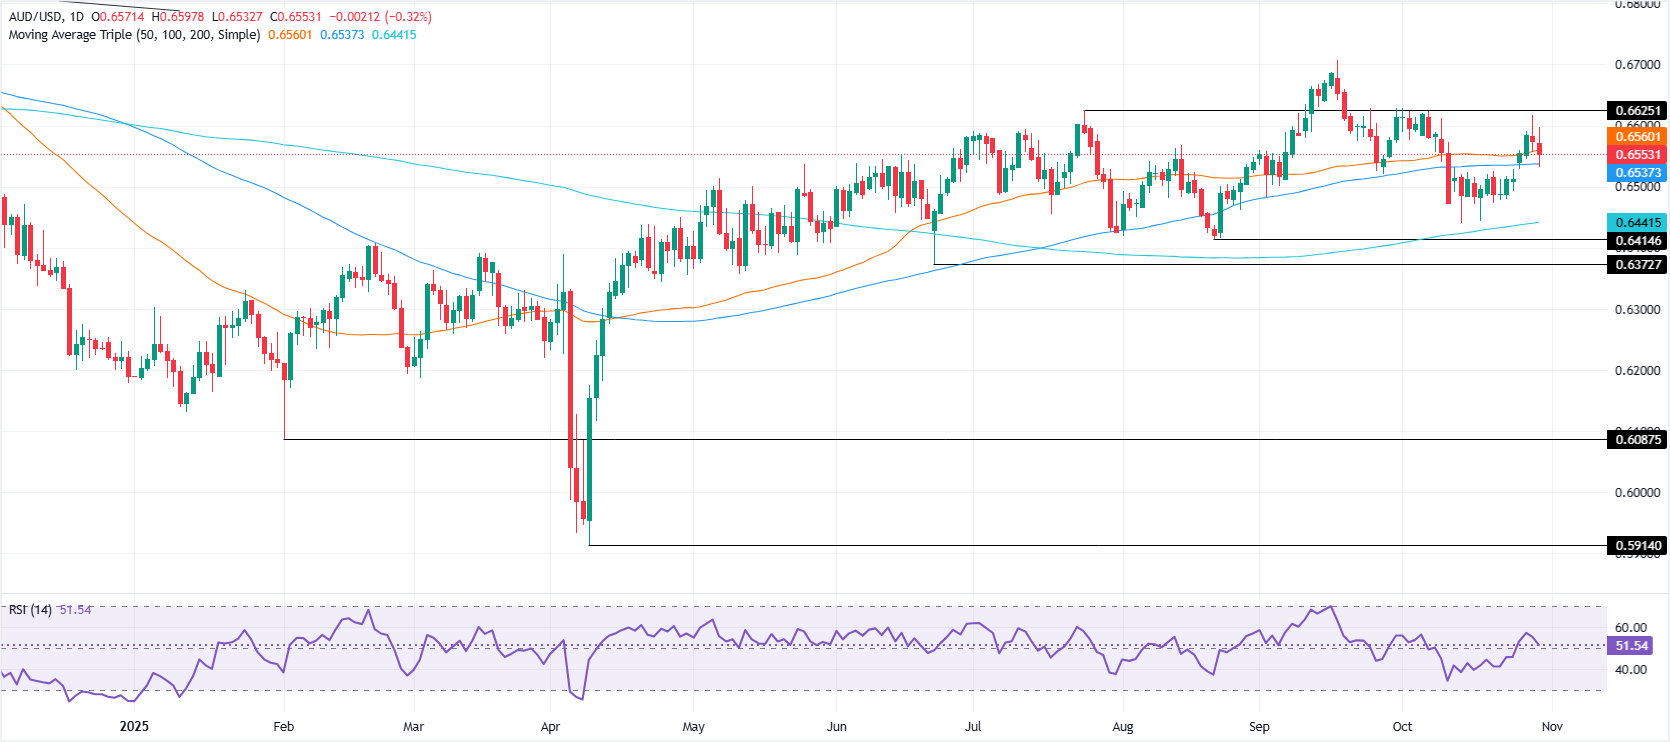
The bias for the AUD/USD remains sideways, though recent US Dollar strength, could push the pair towards the confluence of the 100-day and 20-day SMAs at 0.6535/32. Bears are gathering momentum as shown by the Relative Strength Index (RSI) aiming towards its 50-neutral line.
If AUD/USD tumbles below 0.6533 it would resume the downswing, towards 0.6600 with further support lying at the 200-day SMA at 0.6443. A decisive break will expose the June 23 low at 0.6372.
On the flipside, a move above 0.6561 clears the path to test 0.6600. A breach of the latter will expose the October 29 high at 0.6617 and 0.6650.
AUD/USD Price Chart – Daily
Australian Dollar Price This Month
The table below shows the percentage change of Australian Dollar (AUD) against listed major currencies this month. Australian Dollar was the strongest against the Japanese Yen.
| USD | EUR | GBP | JPY | CAD | AUD | NZD | CHF | |
|---|---|---|---|---|---|---|---|---|
| USD | 1.43% | 2.20% | 4.21% | 0.46% | 0.90% | 0.91% | 0.66% | |
| EUR | -1.43% | 0.78% | 2.73% | -0.96% | -0.50% | -0.49% | -0.76% | |
| GBP | -2.20% | -0.78% | 1.97% | -1.72% | -1.26% | -1.25% | -1.51% | |
| JPY | -4.21% | -2.73% | -1.97% | -3.56% | -3.18% | -2.93% | -3.31% | |
| CAD | -0.46% | 0.96% | 1.72% | 3.56% | 0.44% | 0.46% | 0.20% | |
| AUD | -0.90% | 0.50% | 1.26% | 3.18% | -0.44% | 0.01% | -0.26% | |
| NZD | -0.91% | 0.49% | 1.25% | 2.93% | -0.46% | -0.01% | -0.26% | |
| CHF | -0.66% | 0.76% | 1.51% | 3.31% | -0.20% | 0.26% | 0.26% |
The heat map shows percentage changes of major currencies against each other. The base currency is picked from the left column, while the quote currency is picked from the top row. For example, if you pick the Australian Dollar from the left column and move along the horizontal line to the US Dollar, the percentage change displayed in the box will represent AUD (base)/USD (quote).
Author

Christian Borjon Valencia
FXStreet
Markets analyst, news editor, and trading instructor with over 14 years of experience across FX, commodities, US equity indices, and global macro markets.


