AUD/USD Price Forecast:Overbought signals emerge as pair tests yearly peak
- AUD/USD rebounds toward year-to-date highs as weaker US Jobless Claims deepen pressure on the US Dollar.
- Technical signals favour further upside, though overbought momentum indicators hint at a possible pause.
- Bulls need a close above 0.6707 to extend the rally; a drop below 0.6600 would weaken the near-term outlook.
The Australian Dollar (AUD) rebounds sharply against the US Dollar (USD) on Thursday, shrugging off earlier weakness triggered by softer-than-expected Australian employment data as selling pressure on the Greenback intensifies following weaker US Initial Jobless Claims.
At the time of writing, AUD/USD is trading around 0.6671, just shy of its year-to-date peak after rebounding from an intraday low near 0.6626. Meanwhile, the US Dollar Index (DXY), which tracks the Greenback’s value against a basket of six major currencies, is trading near 98.25, its lowest level in eight weeks.
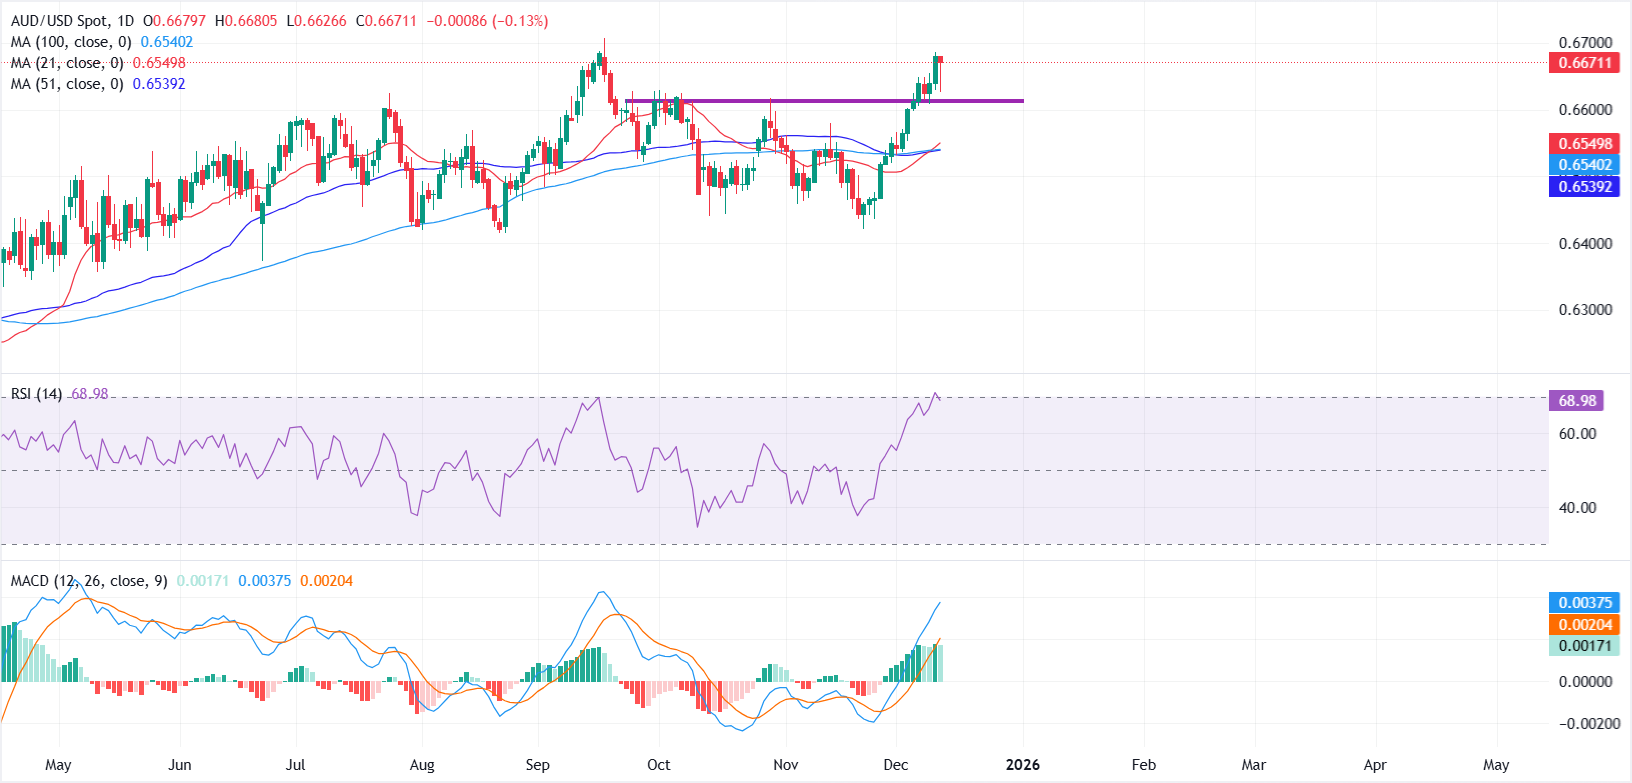
From a technical perspective, AUD/USD continues to trade on the front foot after bottoming out near the 0.6421 low on November 21. Since then, the daily chart shows price steadily climbing above key moving averages, with the pair trading well above the 21-day, 50-day, and 100-day Simple Moving Averages (SMAs).
Immediate resistance sits near this year’s peak at 0.6707, marked on September 17 and representing the strongest level since October 2024. A decisive break above 0.6707 would expose the psychological 0.6800 handle as the next upside target, with scope for further gains if bullish momentum continues to improve.
On the downside, the 0.6600 psychological level acts as the first line of support. A daily close back below 0.6600 would undermine the near-term bullish tone and expose the next support region around 0.6540, where all three moving averages converge and form a key technical floor.
Momentum indicators warrant a degree of caution, as the pair may be due for a pause or brief consolidation before attempting a sustained move higher. The Relative Strength Index (RSI) is hovering close to overbought territory near 68.
The Moving Average Convergence Divergence (MACD) remains in positive territory, with the MACD line above the Signal line, though the histogram has started to narrow, hinting at a slower pace of upside in the near term.
Australian Dollar FAQs
One of the most significant factors for the Australian Dollar (AUD) is the level of interest rates set by the Reserve Bank of Australia (RBA). Because Australia is a resource-rich country another key driver is the price of its biggest export, Iron Ore. The health of the Chinese economy, its largest trading partner, is a factor, as well as inflation in Australia, its growth rate and Trade Balance. Market sentiment – whether investors are taking on more risky assets (risk-on) or seeking safe-havens (risk-off) – is also a factor, with risk-on positive for AUD.
The Reserve Bank of Australia (RBA) influences the Australian Dollar (AUD) by setting the level of interest rates that Australian banks can lend to each other. This influences the level of interest rates in the economy as a whole. The main goal of the RBA is to maintain a stable inflation rate of 2-3% by adjusting interest rates up or down. Relatively high interest rates compared to other major central banks support the AUD, and the opposite for relatively low. The RBA can also use quantitative easing and tightening to influence credit conditions, with the former AUD-negative and the latter AUD-positive.
China is Australia’s largest trading partner so the health of the Chinese economy is a major influence on the value of the Australian Dollar (AUD). When the Chinese economy is doing well it purchases more raw materials, goods and services from Australia, lifting demand for the AUD, and pushing up its value. The opposite is the case when the Chinese economy is not growing as fast as expected. Positive or negative surprises in Chinese growth data, therefore, often have a direct impact on the Australian Dollar and its pairs.
Iron Ore is Australia’s largest export, accounting for $118 billion a year according to data from 2021, with China as its primary destination. The price of Iron Ore, therefore, can be a driver of the Australian Dollar. Generally, if the price of Iron Ore rises, AUD also goes up, as aggregate demand for the currency increases. The opposite is the case if the price of Iron Ore falls. Higher Iron Ore prices also tend to result in a greater likelihood of a positive Trade Balance for Australia, which is also positive of the AUD.
The Trade Balance, which is the difference between what a country earns from its exports versus what it pays for its imports, is another factor that can influence the value of the Australian Dollar. If Australia produces highly sought after exports, then its currency will gain in value purely from the surplus demand created from foreign buyers seeking to purchase its exports versus what it spends to purchase imports. Therefore, a positive net Trade Balance strengthens the AUD, with the opposite effect if the Trade Balance is negative.
Author

Vishal Chaturvedi
FXStreet
I am a macro-focused research analyst with over four years of experience covering forex and commodities market. I enjoy breaking down complex economic trends and turning them into clear, actionable insights that help traders stay ahead of the curve.