|

AUD/USD Price Analysis: Tests region below 0.6700 amid negative market sentiment

  • AUD/USD has tested region below 0.6700 as the risk profile remains downbeat.
  • The USD Index has refreshed its weekly high at 103.17 as the Fed is expected to raise interest rates further.
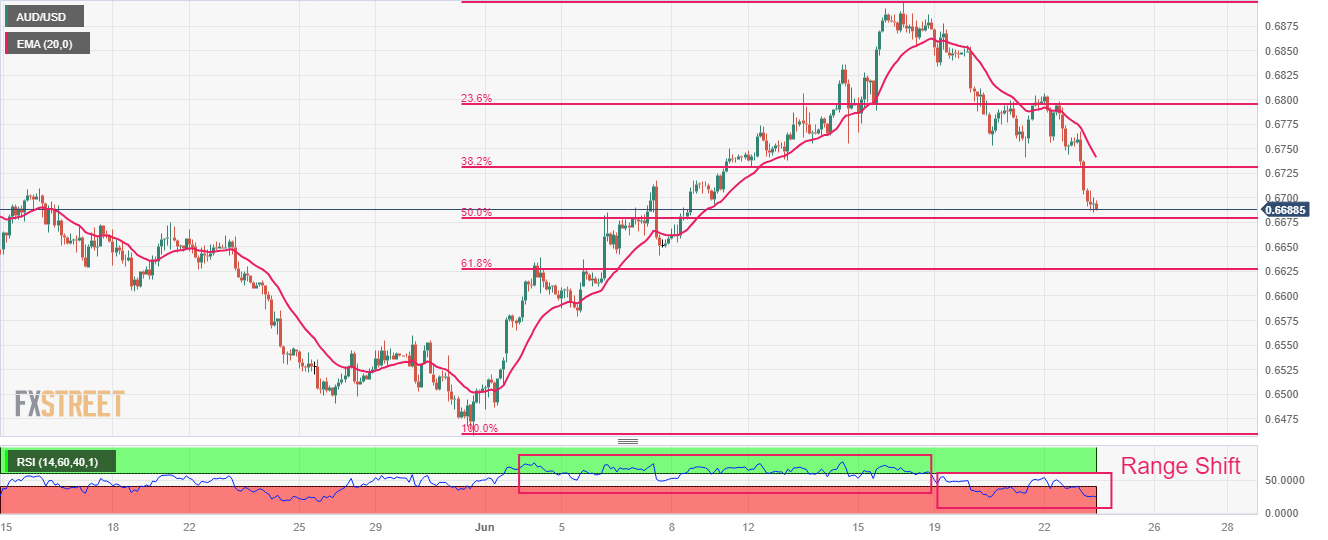
  • AUD/USD has dropped to near the 50% Fibonacci retracement at 0.6680.

The AUD/USD pair has tested territory below the round-level support of 0.6700 for the first time in the past ten trading sessions. The Aussie asset has faced immense pressure as the market mood has turned quite risk-off due to fears of the global recession.

The US Dollar Index (DXY) is on the seventh cloud amid a risk-aversion theme. The USD Index has refreshed its weekly high at 103.17 as the Federal Reserve (Fed) is expected to raise interest rates further to achieve price stability.

Meanwhile, upbeat preliminary S&P PMI numbers have failed to support the Australian Dollar. Manufacturing PMI landed at 48.6, higher than the expectations of 48.1 and the former release of 48.4. Also, Services PMI at 50.7 outperformed expectations of 50.1 but remained lower than the former release of 52.1.

AUD/USD has dropped to near the 50% Fibonacci retracement (plotted from May 31 low at 0.6458 to June 16 high at 0.6900) at 0.6680 on a two-hour scale. Downward-sloping 20-period Exponential Moving Average (EMA) at 0.6743 indicates that the selling pressure is on Australian Dollar bulls.

The Relative Strength Index (RSI) (14) has shifted into the bearish range of 20.00-60.00 from the bullish range in which the momentum oscillator would face selling pressure after a pullback to 60.00.

A decisive break below the 50% Fibo retracement at 0.6680 would expose the asset to 61.8% Fibo retracement at 0.6628 followed by June 05 low at 0.6579.

On the flip side, a confident break above the round-level resistance of 0.6800 would expose the asset to June 20 high at 0.6855. A break above the latter would drive the asset toward June 16 high at 0.6900.

AUD/USD two-hour chart                  
AUD/USD

Overview
Today last price0.6688
Today Daily Change-0.0068
Today Daily Change %-1.01
Today daily open0.6756
 
Trends
Daily SMA200.6696
Daily SMA500.6681
Daily SMA1000.6716
Daily SMA2000.6692
 
Levels
Previous Daily High0.6806
Previous Daily Low0.6745
Previous Weekly High0.69
Previous Weekly Low0.6732
Previous Monthly High0.6818
Previous Monthly Low0.6458
Daily Fibonacci 38.2%0.6768
Daily Fibonacci 61.8%0.6783
Daily Pivot Point S10.6732
Daily Pivot Point S20.6708
Daily Pivot Point S30.667
Daily Pivot Point R10.6793
Daily Pivot Point R20.683
Daily Pivot Point R30.6855

Author

Sagar Dua

Sagar Dua

FXStreet

Sagar Dua is associated with the financial markets from his college days. Along with pursuing post-graduation in Commerce in 2014, he started his markets training with chart analysis.


More from Sagar Dua
Share:

Editor's Picks

AUD/USD flirts with 0.7000, lowest since early August amid bullish USD

AUD/USD hits a fresh low since early August during the Asian session on Friday and looks vulnerable near 0.7000 after breaking below the 200-day SMA overnight. Against the backdrop of the hawkish Fed, a two-day rally in oil prices revives inflation fears and continues to push US bond yields to multi-year highs. Adding to this, geopolitical risks lift the US Dollar to a two-month high, overshadowing RBA rate hike bets and weighing on the pair.

USD/JPY pulls back from three-week high after failing near 159.00

USD/JPY edges lower during the Asian session on Friday, stalling its recent strong move to a three-week high of 159.00 as Japanese Yen bears turn cautious amid intervention fears. Meanwhile, the US Dollar retains a strong bullish undertone as the Fed's hawkish outlook and oil-driven inflation fears continue to push US bond yields to multi-year peaks. Furthermore, the BoJ's dovish rate hike last week might cap JPY and support spot prices.

Gold treads water below $4,300

Gold grabs some buying attention and advances marginally at the end of the week, partially retracing the weekly decline, although it is still navigating below the key $4,300 mark per troy ounce. The fresh selling bias on the Greenback and the modest decline in US Treasury yields appear to support the humble advance in the precious metal.

Crypto Today: Bitcoin and Ethereum edge lower, XRP extends recovery as macro headwinds weigh

The broader cryptocurrency market is consolidating on Friday, with Bitcoin paring losses slightly above $84,000. Ethereum declines in tandem with BTC. Ripple (XRP), meanwhile, paints a different picture.


Fed vs BoJ: Both hiked. The market only believes one of them – and the chart shows which
The Federal Reserve (Fed) and the Bank of Japan (BoJ) have just done something remarkably similar. Both central banks raised interest rates by 25 basis points (bps) last week, both are confronting inflation risks, and both signal that future decisions will depend on incoming economic data.
Fed vs BoJ: Both hiked. The market only believes one of them – and the chart shows which

The Fed and the BoJ have just done something remarkably similar. Both central banks raised interest rates by 25 bps last week, both are confronting inflation risks, and both signal that future decisions will depend on incoming economic data.













