|

AUD/USD Price Analysis: Snaps two-day rebound within bear flag, 0.6510 eyed

  • AUD/USD takes offers to refresh intraday low inside bearish chart formation.
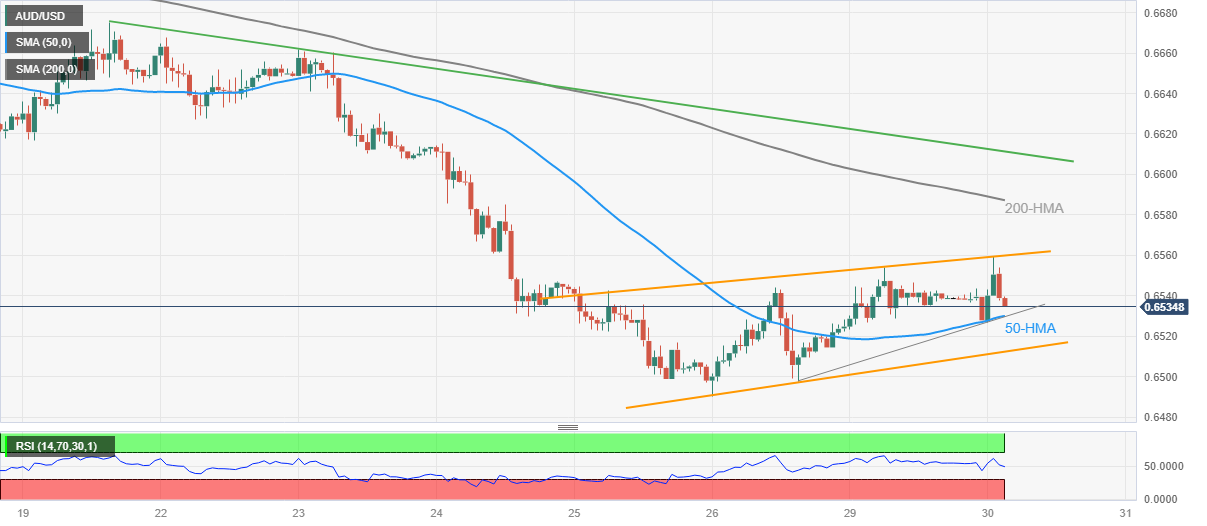
  • Absence of oversold RSI (14) line adds strength to downside bias.
  • Aussie pair’s recovery remains elusive unless breaking one-week-old falling resistance line.

AUD/USD renews its intraday bottom around 0.6530 as it prints the first daily loss in three amid early Tuesday morning in Europe. In doing so, the Aussie pair fails to cheer broad US Dollar strength amid fears of softer economic growth in Australia.

While portraying the same, the AUD/USD pair prints a bearish flag chart pattern on the hourly timeframe.

Apart from the bearish chart formation, a near 50.0 level of the RSI (14) line allows the Aussie pair sellers to keep the reins.

That said, a convergence of the 50-Hour Moving Average (HMA) and an ascending support line from Friday restricts the AUD/USD pair’s immediate downside to around 0.6530 within the flag.

Following that, the 0.6510 level will be the key as a break of which confirms the bearish chart formation, making it vulnerable to refreshing the yearly low, currently around 0.6490.

It’s worth noting that the bear flag confirmation hints at a theoretical target of around 0.6340.

Meanwhile, the AUD/USD pair’s corrective bounce needs to cross the stated flag’s top line, close to 0.6560 at the latest.

Even so, the 200-HMA and a one-week-old descending resistance line, near 0.6615 by the press time, could challenge the Aussie bulls before giving them control.

AUD/USD: Hourly chart

Trend: Further downside expected

Additional important levels

Overview
Today last price0.6516
Today Daily Change-0.0022
Today Daily Change %-0.34%
Today daily open0.6538
 
Trends
Daily SMA200.6655
Daily SMA500.6673
Daily SMA1000.677
Daily SMA2000.6703
 
Levels
Previous Daily High0.6554
Previous Daily Low0.6514
Previous Weekly High0.6668
Previous Weekly Low0.649
Previous Monthly High0.6806
Previous Monthly Low0.6574
Daily Fibonacci 38.2%0.6539
Daily Fibonacci 61.8%0.653
Daily Pivot Point S10.6517
Daily Pivot Point S20.6496
Daily Pivot Point S30.6477
Daily Pivot Point R10.6557
Daily Pivot Point R20.6575
Daily Pivot Point R30.6596

Author

Anil Panchal

Anil Panchal

FXStreet

Anil Panchal has nearly 15 years of experience in tracking financial markets. With a keen interest in macroeconomics, Anil aptly tracks global news/updates and stays well-informed about the global financial moves and their implications.

More from Anil Panchal
Share:

Markets move fast. We move first.

Orange Juice Newsletter brings you expert driven insights - not headlines. Every day on your inbox.

By subscribing you agree to our Terms and conditions.

Editor's Picks

EUR/USD ticks lower following the release of FOMC Minutes

The US Dollar found some near-term demand following the release of the FOMC meeting minutes, with the EUR/USD pair currently piercing the 1.1750 threshold. The document showed officials are still willing to trim interest rates. Meanwhile, thinned holiday trading keeps major pairs confined to familiar levels.

GBP/USD remains sub- 1.3500, remains in the red

The GBP/USD lost traction early in the American session, maintaining the sour tone and trading around 1.3460 following the release of the FOMC meeting minutes. Trading conditions remain thin ahead of the New Year holiday, limiting the pair's volatility.

Gold stable above $4,350 as the year comes to an end

Gold price got to recover some modest ground on Tuesday, holding on to intraday gains and changing hands at $4,360 a troy ounce in the American afternoon. The bright metal showed no reaction to the release of the FOMC December meeting minutes.

Ethereum: ETH holds above $2,900 despite rising selling activity

Ethereum (ETH) held the $2,900 level despite seeing increased selling pressure over the past week. The Exchange Netflow metric showed deposits outweighed withdrawals by about 400K ETH. The high value suggests rising selling activity amid the holiday season.

Economic outlook 2026-2027 in advanced countries: Solidity test

After a year marked by global economic resilience and ending on a note of optimism, 2026 looks promising and could be a year of solid economic performance. In our baseline scenario, we expect most of the supportive factors at work in 2025 to continue to play a role in 2026.

Crypto market outlook for 2026

Year 2025 was volatile, as crypto often is.  Among positive catalysts were favourable regulatory changes in the U.S., rise of Digital Asset Treasuries (DAT), adoption of AI and tokenization of Real-World-Assets (RWA).