|

AUD/USD Price Analysis: Retreats to 0.6600 as RBA to retain neutral policy stance

  • AUD/USD is facing hurdles after a less-confident pullback move ahead of US GDP.
  • Consistently declining Australian CPI indicates that the RBA will keep interest rates steady further.
  • AUD/USD is in a bearish trajectory after a breakdown of the Inverted Flag chart pattern.

The AUD/USD pair has sensed selling pressure after a less-confident pullback to near 0.6611 in the Tokyo session. The Aussie asset has resumed its downside journey as the USD Dollar Index (DXY) is concluding its marginal corrective move.

Investors are expected to shift their funds into the US Dollar amid anxiety ahead of the United States Gross Domestic Product (GDP) (Q1) data. A decline is expected to 2.0% from the former print of 2.6%. The street is anticipating a decline in GDP numbers as firms have postponed their expansion plans to avoid higher interest obligations.

The Australian Dollar witnessed an extreme sell-off on Wednesday after the soft landing of inflation data. The consistently declining Australian Consumer Price Index (CPI) indicates that the Reserve Bank of Australia (RBA) will keep interest rates steady further.

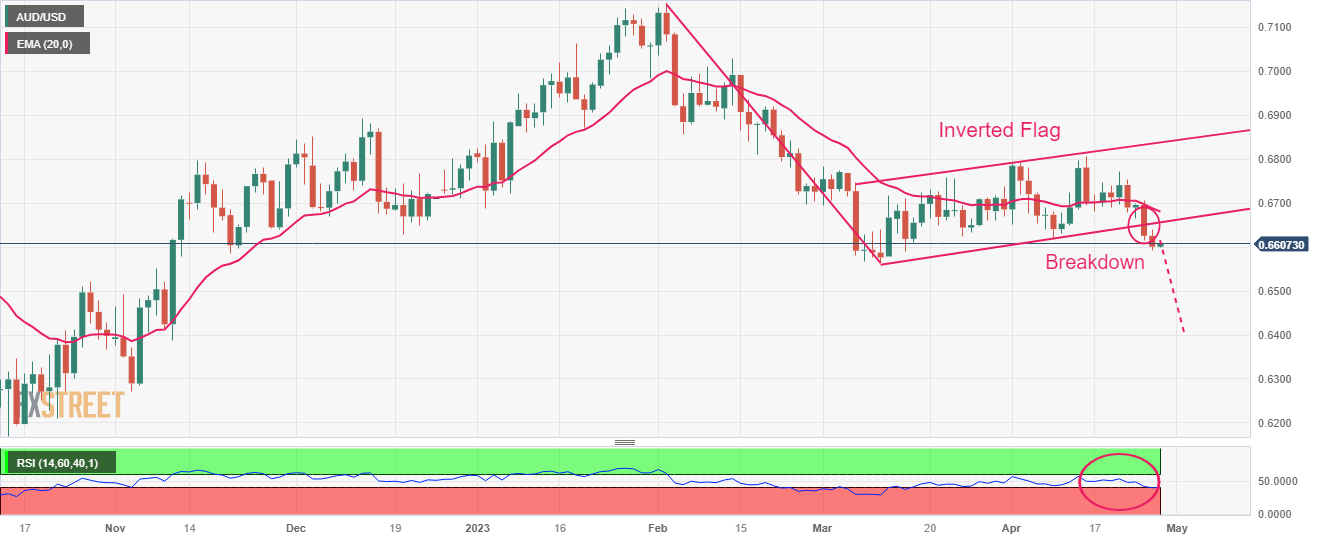
AUD/USD is in a bearish trajectory after a breakdown of the Inverted Flag chart pattern formed on the daily scale. The aforementioned chart pattern is a trend continuation pattern in which a long consolidation is followed by a breakdown.

The 20-period Exponential Moving Average (EMA) around 0.6680 is acting as a barricade for the Aussie bulls.

The Relative Strength Index (RSI) (14) has slipped into the bearish range of 20.00-40.00, which indicates an activation of downside momentum.

US Dollar bulls will flex their muscles if the Aussie asset will drop below March 15 low at 0.6590. An occurrence of the same will expose the asset to March 08 low at 0.6568 followed by 02 November 2022 high around 0.6500.

In an alternate scenario, only a decisive move above the round-level resistance of 0.6800 will drive the asset toward February 23 high at 0.6872 and February 20 high at 0.6920.

AUD/USD daily chart

AUD/USD

Overview
Today last price0.6605
Today Daily Change0.0004
Today Daily Change %0.06
Today daily open0.6601
 
Trends
Daily SMA200.6698
Daily SMA500.6708
Daily SMA1000.6796
Daily SMA2000.674
 
Levels
Previous Daily High0.6639
Previous Daily Low0.6592
Previous Weekly High0.6772
Previous Weekly Low0.6678
Previous Monthly High0.6784
Previous Monthly Low0.6564
Daily Fibonacci 38.2%0.661
Daily Fibonacci 61.8%0.6621
Daily Pivot Point S10.6582
Daily Pivot Point S20.6563
Daily Pivot Point S30.6534
Daily Pivot Point R10.663
Daily Pivot Point R20.6658
Daily Pivot Point R30.6677

Author

Sagar Dua

Sagar Dua

FXStreet

Sagar Dua is associated with the financial markets from his college days. Along with pursuing post-graduation in Commerce in 2014, he started his markets training with chart analysis.

More from Sagar Dua
Share:

Editor's Picks

EUR/USD eyes nine-day EMA barrier after rebounding from 1.1600

EUR/USD gains ground after registering modest losses in the previous session, trading around 1.1620 during the Asian hours on Friday. The technical analysis of the daily chart suggests an ongoing bearish bias as the pair remains within the descending channel pattern.

GBP/USD: Pound Sterling ticks up against US Dollar in countdown to US NFP

The Pound Sterling trades marginally higher to near 1.3365 against the US Dollar during the Asian trading session on Friday. The GBP/USD pair edges up as the US Dollar ticks down ahead of the United States Nonfarm Payrolls data for February, which will be published at 13:30 GMT.

Gold rises but remains on track for weekly loss in five weeks

Gold price recovers its recent losses from the previous session on Friday. The yellow metal advances as the broader precious metals market rebounds on safe-haven demand. However, the yellow metal is on track for its first weekly decline in five weeks as escalating Middle East tensions push oil prices higher, fueling inflation concerns and reducing bets on Federal Reserve rate cuts.

Bitcoin, Ethereum and Ripple at risk as US-Iran war extends

Bitcoin, Ethereum, and Ripple trade cautiously at press time on Friday, close to key support levels after a roughly 2% pullback the previous day. Bitcoin holds above $71,000, Ethereum at $2,000, and XRP continues to consolidate in a sideways range.

The market compass is pointing at a barrel of Oil

The Asian open is arriving with equities leaning the wrong way, and the reason is not complicated. The market’s compass needle has snapped firmly toward crude. In this tape, oil is not just another input price; it is the gravitational center around which every asset class is orbiting.

Top 3 Price Prediction: Bitcoin, Ethereum, Ripple at risk as US-Iran war extends

Bitcoin, Ethereum, and Ripple trade cautiously at press time on Friday, close to key support levels after a roughly 2% pullback the previous day. Bitcoin holds above $71,000, Ethereum at $2,000, and XRP continues to consolidate in a sideways range.