|

AUD/USD Price Analysis: Retreats from 100-HMA but bulls remain hopeful above 0.6400

  • AUD/USD pares the first daily gains in four but defends the bullish chart breakout.
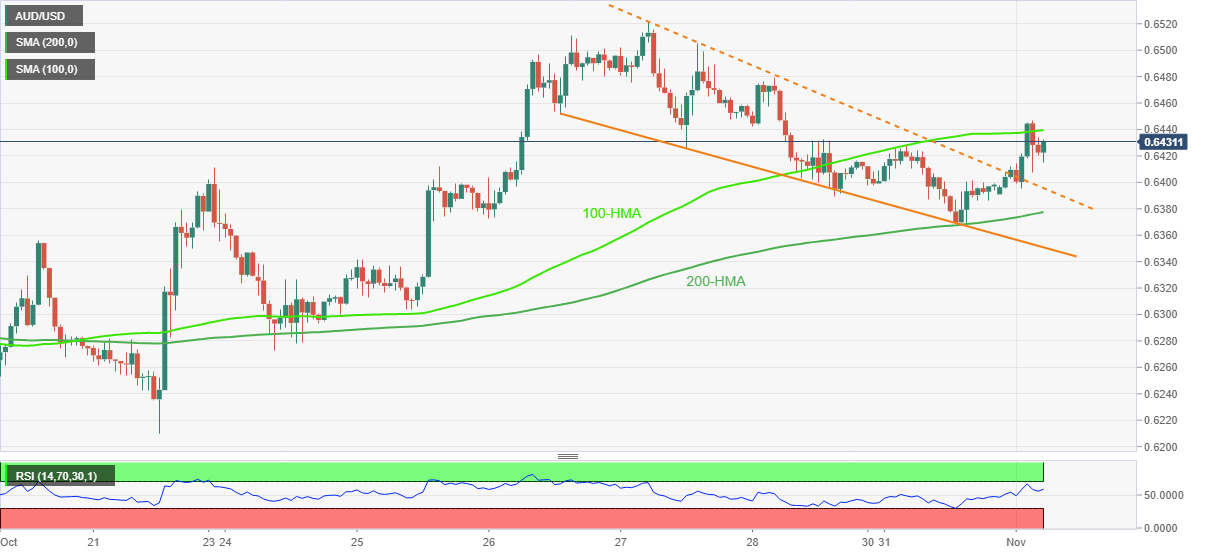
  • 100-HMA challenges rising wedge confirmation amid firmer RSI.
  • Sustained trading above 200-HMA favors bulls to aim for October’s peak.

AUD/USD steps back from intraday high to 0.6415, after snapping a three-day downtrend, ahead of Tuesday’s European session. In doing so, the Aussie pair eases from the 100-HMA as the Aussie pair traders recollect the Reserve Bank of Australia’s (RBA) dovish rate hikes.

Also read: RBA: Higher interest rates and higher inflation are putting pressure on the budgets of many households

However, the quote still defends the early Asian session’s falling wedge breakout amid a firmer RSI (14), which in turn favors buyers. On the same line could be the pair’s successful trading above the 200-HMA.

That said, the 100-HMA level surrounding 0.6440 restricts the quote’s immediate upside ahead of the previous weekly top near 0.6525.

It should be noted, though, that multiple levels marked during late September and early October highlight 0.6540-50 as the short-term key hurdle to the north.

Meanwhile, the AUD/USD pair’s further weakness could aim for the resistance-turned-support line from the wedge, around 0.6395.

Following that, the 200-HMA and the stated wedge’s bottom line, close to 0.6375 and 0.6350, could challenge the AUD/USD bears.

In a case where the Aussie pair remains bearish past 0.6350, the odds of witnessing a south-run towards October’s low near 0.6170 can’t be ruled out.

AUD/USD: Hourly chart

Trend: Further upside expected

Additional important levels

Overview
Today last price0.6425
Today Daily Change0.0027
Today Daily Change %0.42%
Today daily open0.6398
 
Trends
Daily SMA200.6355
Daily SMA500.6576
Daily SMA1000.6747
Daily SMA2000.6986
 
Levels
Previous Daily High0.6428
Previous Daily Low0.6368
Previous Weekly High0.6522
Previous Weekly Low0.6272
Previous Monthly High0.6548
Previous Monthly Low0.617
Daily Fibonacci 38.2%0.6391
Daily Fibonacci 61.8%0.6405
Daily Pivot Point S10.6368
Daily Pivot Point S20.6338
Daily Pivot Point S30.6308
Daily Pivot Point R10.6428
Daily Pivot Point R20.6458
Daily Pivot Point R30.6488

Author

Anil Panchal

Anil Panchal

FXStreet

Anil Panchal has nearly 15 years of experience in tracking financial markets. With a keen interest in macroeconomics, Anil aptly tracks global news/updates and stays well-informed about the global financial moves and their implications.

More from Anil Panchal
Share:

Markets move fast. We move first.

Orange Juice Newsletter brings you expert driven insights - not headlines. Every day on your inbox.

By subscribing you agree to our Terms and conditions.

Editor's Picks

EUR/USD consolidates below 1.1700 amid cautious markets

EUR/USD is holding steady below 1.1700 in the European trading hours on Thursday. The pair pauses its losing streak as the US Dollar consolidates the recent recovery amid a cautious market mood and ahead of the mid-tier US employment data. 

GBP/USD turns lower to near 1.3450 amid softer risk tone

GBP/USD loses ground to trade near 1.3450 in the early European session on Thursday. Markets turn cautious amid simmering geopolitical tensions and ahead of the US labor market data due later in the day. 

Gold sticks to intraday losses below $4,450; seems vulnerable to slide further

Gold maintains its offered tone through the first half of the European session and currently trades near the lower end of its daily range, down for the second straight day. The downfall lacks any obvious fundamental catalyst and could be attributed to some follow-through profit-taking ahead of the release of the US Nonfarm Payrolls report on Friday. 

Pi Network flashes bearish potential as selling pressure mounts

Pi Network trades above $0.2000 at press time on Thursday, following a nearly 2% decline the previous day. Centralized Exchanges have received 1.90 million PI tokens over the last 24 hours, suggesting risk-off sentiment among holders. The technical outlook for the PI token remains bearish, with a risk of a cross below the 20-day Exponential Moving Average. 

2026 economic outlook: Clear skies but don’t unfasten your seatbelts yet

Most years fade into the background as soon as a new one starts. Not 2025: a year of epochal shifts, in which the macroeconomy was the dog that did not bark. What to expect in 2026? The shocks of 2025 will not be undone, but neither will they be repeated.

Pi Network Price Forecast: PI flashes bearish potential as selling pressure mounts

Pi Network trades above $0.2000 at press time on Thursday, following a nearly 2% decline the previous day. Centralized Exchanges have received 1.90 million PI tokens over the last 24 hours, suggesting risk-off sentiment among holders.