AUD/USD Price Analysis: Recovers further from YTD low, eyes FOMC minutes for fresh impetus
- AUD/USD rebounds from a fresh YTD low touched on Wednesday amid a modest USD slide.
- China’s economic woes might cap gains for the Aussie ahead of the FOMC meeting minutes.
- Any subsequent move up is more likely to confront a stiff barrier near the 0.6520 confluence.

The AUD/USD pair stages a goodish intraday recovery from the 0.6430-0.6425 region, or its lowest level since November 2022 touched this Wednesday and builds on the momentum through the early part of the European session. Spot prices climb to a fresh daily top, around the 0.6480 region in the last hour and for now, seem to have snapped a six-day losing streak.
Retreating US Treasury bond yields, along with a positive tone around the US equity futures, exerts downward pressure on the safe-haven US Dollar (USD) and prompts some short-covering around the AUD/USD pair. That said, growing concerns about the worsening economic conditions in China might cap gains for the China-proxy Aussie. Traders might also refrain from placing aggressive bets and prefer to wait on the sidelines ahead of the FOMC meeting minutes, due for release later during the US session.
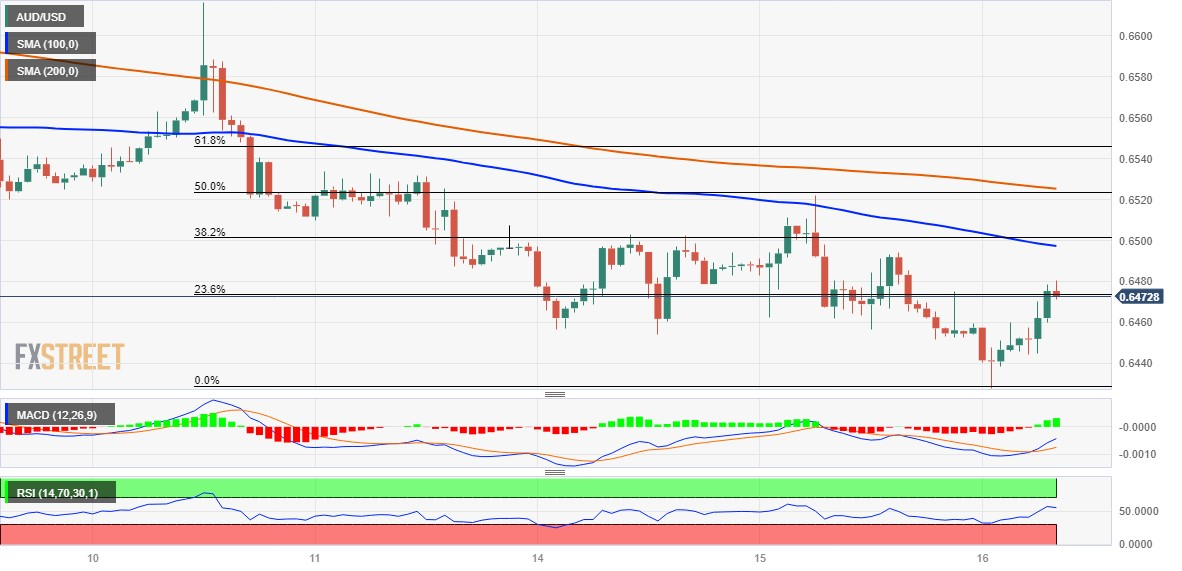
From a technical perspective, the momentum lifts the AUD/USD pair beyond the 23.6% Fibonacci retracement level of the recent downfall witnessed over the past week or so. Moreover, oscillators on the 1-hour chart have just started gaining positive traction and support prospects for further intraday appreciating move. Hence, a subsequent strength towards a confluence hurdle near the 0.6500 psychological mark, comprising the 100-hour Simple Moving Average (SMA) and the 38.2% Fibo., looks like a distinct possibility.
That said, technical indicators on the daily chart are holding deep in the bearish territory and suggest that the recovery move could run out of steam near the weekly peak, around the 0.6520 area, set on Tuesday. The said area marks another confluence, comprising the 200-hour SMA and the 50% Fibo. level, which should now act as a key pivotal point. A sustained strength beyond might suggests that the AUD/USD pair has bottomed and shift the bias in favour of bulls, paving the way for some meaningful recovery.
On the flip side, the YTD low, around the 0.6430-0.6425 region, now seems to protect the immediate downside ahead of the 0.6400 round-figure mark. Some follow-through selling will be seen as a fresh trigger for bearish traders and set the stage for the resumption of the recent downward trajectory witnessed over the past month or so, from the 0.6900 double-top resistance. The AUD/USD pair might then weaken further towards the 0.6360 intermediate support en route to the 0.63000 mark and the 0.6265 zone.
AUD/USD 1-hour chart
Technical levels to watch
Author

Haresh Menghani
FXStreet
Haresh Menghani is a detail-oriented professional with 10+ years of extensive experience in analysing the global financial markets.
















