|

AUD/USD Price Analysis: Pares Aussie-employment-induced losses, H&S highlights 0.6865 support

  • AUD/USD rebounds from 0.6865-70 support confluence to consolidate biggest daily loss in two weeks.
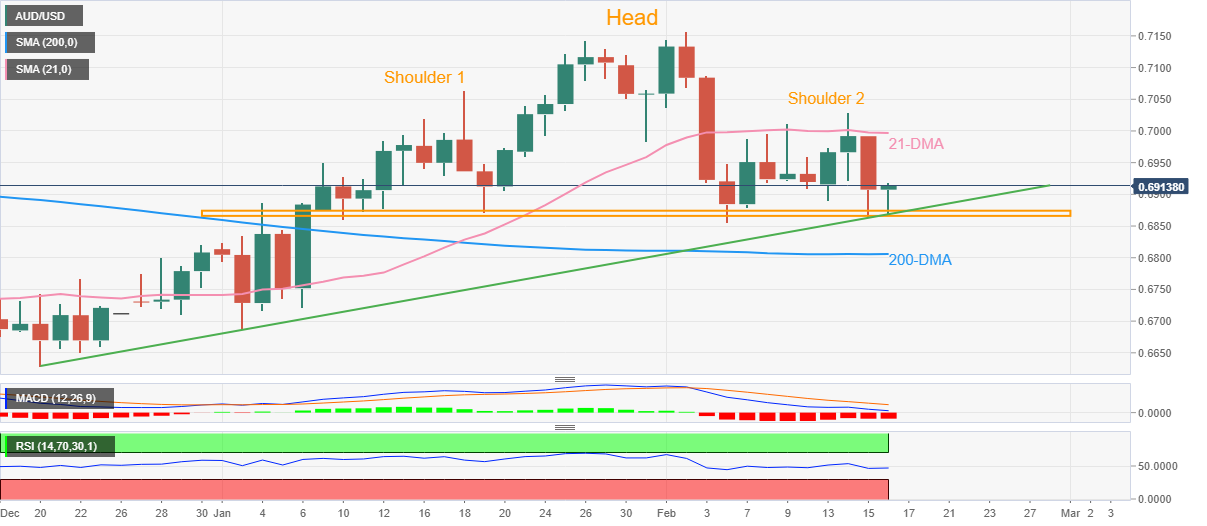
  • Convergence of head-and-shoulders’ neckline, two-month-old ascending trend line challenges bears.
  • Buyers need validation from 21-DMA to retake control.

AUD/USD grinds near intraday high surrounding 0.6915 as it reverses the losses post Australian employment data release during early European morning on Thursday.

In doing so, the Aussie pair portrays a recovery move from the 0.6865-70 support confluence that encompasses the lower line of the six-week-old head-and-shoulders (H&S) bearish chart pattern and a two-month-old ascending trend line.

It’s worth noting, however, that the bearish MACD signals and the steady RSI (14) line join the Aussie pair’s sustained trading below the 21-DMA to challenge the bullish bias unless the quote rises past the immediate DMA hurdle surrounding the 0.7000 psychological magnet.

Even so, the weekly near 0.7030 and the monthly peak of 0.7157 could challenge the AUD/USD bulls afterward.

In a case where the AUD/USD buyers remain in the driver’s seat past 0.7157, the May 2022 high near 0.7285 will be on their radars.

On the contrary, a successful downside break of 0.6865 key support level is necessary for the Aussie pair bears to keep the reins.

Following that, the 200-DMA surrounding 0.6800 and the late 2022 low near 0.6630 may act as validation points during the theoretical south-run targeting the 0.6500 round figure.

Overall, AUD/USD remains bearish but the downside move needs validation from 0.6865.

AUD/USD: Daily chart

Trend: Limited recovery expected

Additional important levels

Overview
Today last price0.6916
Today Daily Change0.0008
Today Daily Change %0.12%
Today daily open0.6908
 
Trends
Daily SMA200.7001
Daily SMA500.6884
Daily SMA1000.6699
Daily SMA2000.6806
 
Levels
Previous Daily High0.6992
Previous Daily Low0.6865
Previous Weekly High0.7011
Previous Weekly Low0.6856
Previous Monthly High0.7143
Previous Monthly Low0.6688
Daily Fibonacci 38.2%0.6913
Daily Fibonacci 61.8%0.6943
Daily Pivot Point S10.6851
Daily Pivot Point S20.6794
Daily Pivot Point S30.6724
Daily Pivot Point R10.6978
Daily Pivot Point R20.7048
Daily Pivot Point R30.7105

Author

Anil Panchal

Anil Panchal

FXStreet

Anil Panchal has nearly 15 years of experience in tracking financial markets. With a keen interest in macroeconomics, Anil aptly tracks global news/updates and stays well-informed about the global financial moves and their implications.

More from Anil Panchal
Share:

Editor's Picks

EUR/USD retreats below 1.1800 following earlier rebound

EUR/USD loses its recovery momentum and trades little-changed on the day below 1.1300 in the second half of the day on Wednesday. The modest improvement seen in risk mood limits the US Dollar's gains and allows the pair to hold its ground.

GBP/USD clings to small gains above 1.3500

GBP/USD is posting moderate gains above 1.3500 on Wednesday. The pair edges higher as the US Dollar meets fresh supply amid a modest improvement seen in risk sentiment following US President Donald Trump’s first State of the Union address.

Gold rises toward $5,200, supported by geopolitics and trade jitters

Gold buyers are back in the game, eyeing $5,200 and beyonf on Wednesday after seeing a correction from monthly highs on Tuesday. The US Dollar slips after Trump’s SOTU fails to impress and as AI-driven worries ease. Dovish Fed bets also weigh.  Gold looks north so long as the key 61.8% Fibo resistance at $5,142 holds on the daily chart.

Bitcoin, Ethereum and Ripple post cautious recovery amid downside risks

Bitcoin, Ethereum, and Ripple are posting a cautious recovery on Wednesday following a market correction earlier this week.  BTC is approaching a key breakdown level, while ETH and XRP are rebounding from crucial support levels.

Nvidia remains at the heart of the AI boom

Nvidia remains at the heart of the AI boom, with Q4 revenue projected near $65.6–66.1 billion, nearly 70% higher year-over-year. But investors are watching cash flow, leverage, and broader AI adoption. Growth is strong, but the AI stress isn’t over.

Cosmos Hub Price Forecast: ATOM rebounds slightly, bearish outlook remains intact

Cosmos Hub (ATOM) price rebounds, trading above $2.05 at the time of writing on Wednesday, after undergoing a sharp correction since last week. Weakening on-chain and derivatives data support a bearish outlook, while technical analysis remains unfavorable.