AUD/USD Price Analysis: Moving up within a range
- AUD/USD has started an up leg within its range.
- The move is facing tough resistance from a cluster of Moving Averages but will probably eventually extend higher.
- A decisive breakout of the range will change the trend, making it more directional.

AUD/USD bounces off the floor of a range it has formed since the middle of May. The pair is in a sideways trend which, given “the trend is your friend”, is more likely than not to extend. This suggests the up leg which began on Monday will probably continue rising to the range highs at circa 0.6709.
AUD/USD 4-hour Chart
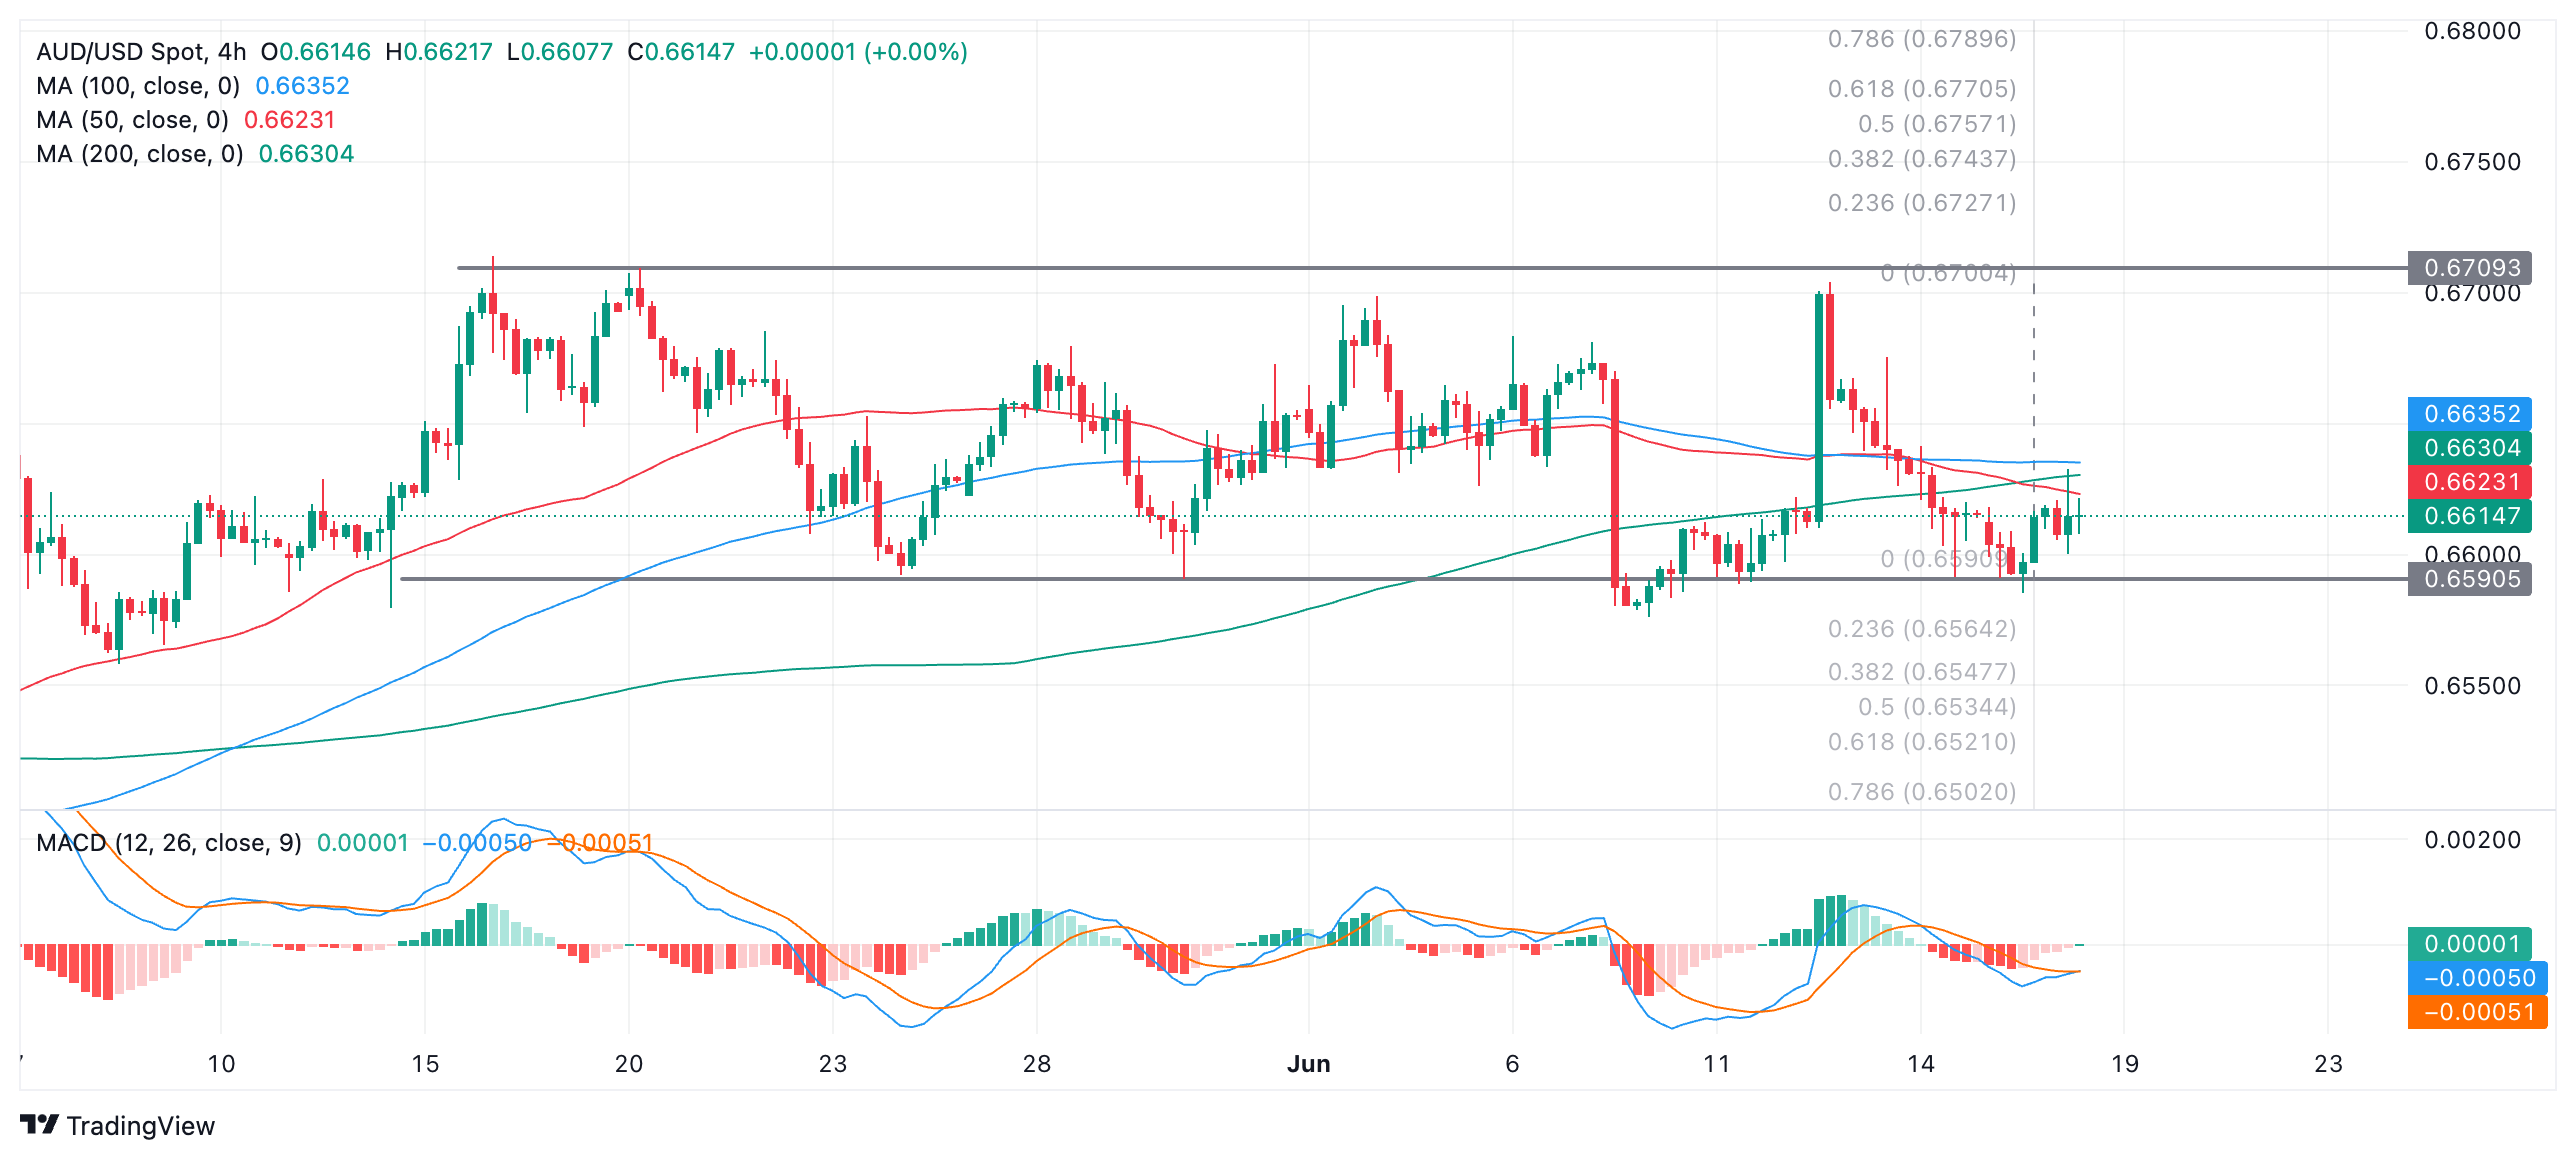
AUD/USD is currently encountering resistance from three major Simple Moving Averages (SMA) on the 4-hour timeframe, the 50, 100 and 200 SMAs. Whilst this is obstructing further upside price will probably eventually break above the cluster. A close above 0.6640 would provide added confirmation of more upside, and probably lead to move up all the way to the range ceiling.
As long as price remains within the bounds of the range it will likely keep oscillating. A decisive breakout of the range would be required to signal a change to a more directional trend. An upside break is marginally more likely to happen because the trend prior to the formation of the range was bullish. The breakout move is likely to be volatile given the range highs and lows have been touched multiple times.
A decisive break above the ceiling of the range would see a follow-through to a conservative target at 0.6770; a decisive break below the range floor would indicate a follow-through to an initial target at 0.6521.
A decisive break would be one in which a longer-than-average candle broke out of the range and closed near its high or low, or three successive candles of the same color broke cleanly through the range top or bottom.
The targets are generated using the technical-analysis method of extrapolating the height of the range by a Fibonacci 0.618 ratio higher (in the case of an upside break) or lower (in the case of a downside break). A more generous target would come from extrapolating the full height of the range.
Author

Joaquin Monfort
FXStreet
Joaquin Monfort is a financial writer and analyst with over 10 years experience writing about financial markets and alt data. He holds a degree in Anthropology from London University and a Diploma in Technical analysis.


