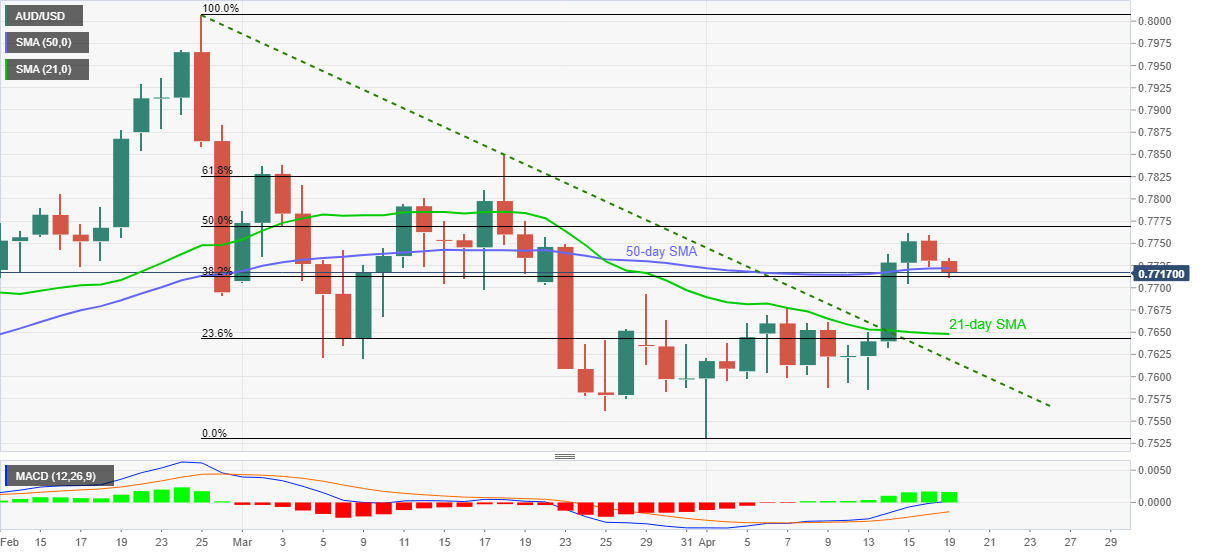
AUD/USD Price Analysis: Mildly offered as sellers attack 50-day SMA


  • AUD/USD prints mild losses while extending Friday’s pullback moves.
  • 38.2% Fibonacci Retracement of February–April downside adds to the support.
  • Monthly top, key Fibonacci retracements will test the bulls during fresh recovery moves.

AUD/USD teases the day’s low of 0.7712, down 0.05% intraday around 0.7725 by the press time of early Monday. In doing so, the sellers jostle with 50-day SMA and 38.2% Fibonacci retracement of the pair’s February-April fall amid bullish MACD.

Given the pair’s inability to cross 50% and 61.8% key Fibonacci retracements, AUD/USD is likely to remain depressed. However, bullish MACD and the immediate supports around 0.7720-10 seem to test the bears.

It’s worth mentioning that the late March top near 0.7690 and 21-day SMA level of 0.7648 precede the previous resistance line from late February, close to 0.7620, before confirming the bearish moves.

On the flip side, a fresh monthly high above the latest peak of 0.7762 should recall the AUD/USD buyers targeting the 50% Fibonacci retracement level of 0.7770 as an immediate target.

Though, any further upside will need a clear break above the 0.7800 round figure before challenging the 61.8% Fibonacci retracement level of 0.7825.

Overall, AUD/USD is likely to extend the latest pullback but sellers should wait for a clear break below 0.7710 for fresh entries.

AUD/USD daily chart

Trend: Further weakness expected

additional important levels

Overview
Today last price 0.7722
Today Daily Change -8 pips
Today Daily Change % -0.10%
Today daily open 0.773
 
Trends
Daily SMA20 0.7645
Daily SMA50 0.7722
Daily SMA100 0.7671
Daily SMA200 0.7429
 
Levels
Previous Daily High 0.776
Previous Daily Low 0.7724
Previous Weekly High 0.7762
Previous Weekly Low 0.7585
Previous Monthly High 0.785
Previous Monthly Low 0.7562
Daily Fibonacci 38.2% 0.7737
Daily Fibonacci 61.8% 0.7746
Daily Pivot Point S1 0.7716
Daily Pivot Point S2 0.7702
Daily Pivot Point S3 0.768
Daily Pivot Point R1 0.7753
Daily Pivot Point R2 0.7775
Daily Pivot Point R3 0.7789


Share: Feed news

Information on these pages contains forward-looking statements that involve risks and uncertainties. Markets and instruments profiled on this page are for informational purposes only and should not in any way come across as a recommendation to buy or sell in these assets. You should do your own thorough research before making any investment decisions. FXStreet does not in any way guarantee that this information is free from mistakes, errors, or material misstatements. It also does not guarantee that this information is of a timely nature. Investing in Open Markets involves a great deal of risk, including the loss of all or a portion of your investment, as well as emotional distress. All risks, losses and costs associated with investing, including total loss of principal, are your responsibility. The views and opinions expressed in this article are those of the authors and do not necessarily reflect the official policy or position of FXStreet nor its advertisers. The author will not be held responsible for information that is found at the end of links posted on this page.

If not otherwise explicitly mentioned in the body of the article, at the time of writing, the author has no position in any stock mentioned in this article and no business relationship with any company mentioned. The author has not received compensation for writing this article, other than from FXStreet.

FXStreet and the author do not provide personalized recommendations. The author makes no representations as to the accuracy, completeness, or suitability of this information. FXStreet and the author will not be liable for any errors, omissions or any losses, injuries or damages arising from this information and its display or use. Errors and omissions excepted.

The author and FXStreet are not registered investment advisors and nothing in this article is intended to be investment advice.

Recommended content


Recommended content

Editors’ Picks

US economy grows at an annual rate of 1.6% in Q1 – LIVE

US economy grows at an annual rate of 1.6% in Q1 – LIVE

The US' real GDP expanded at an annual rate of 1.6% in the first quarter, the US Bureau of Economic Analysis' first estimate showed on Thursday. This reading came in worse than the market expectation for a growth of 2.5%.

FOLLOW US LIVE

EUR/USD retreats to 1.0700 after US GDP data

EUR/USD retreats to 1.0700 after US GDP data

EUR/USD came under modest bearish pressure and retreated to the 1.0700 area. Although the US data showed that the economy grew at a softer pace than expected in Q1, strong inflation-related details provided a boost to the USD.

EUR/USD News

GBP/USD declines below 1.2500 with first reaction to US data

GBP/USD declines below 1.2500 with first reaction to US data

GBP/USD declined below 1.2500 and erased a portion of its daily gains with the immediate reaction to the US GDP report. The US economy expanded at a softer pace than expected in Q1 but the price deflator jumped to 3.4% from 1.8%. 

GBP/USD News

Gold falls below $2,330 as US yields push higher

Gold falls below $2,330 as US yields push higher

Gold came under modest bearish pressure and declined below $2,330. The benchmark 10-year US Treasury bond yield is up more than 1% on the day after US GDP report, making it difficult for XAU/USD to extend its daily recovery.

Gold News

XRP extends its decline, crypto experts comment on Ripple stablecoin and benefits for XRP Ledger

XRP extends its decline, crypto experts comment on Ripple stablecoin and benefits for XRP Ledger

Ripple extends decline to $0.52 on Thursday, wipes out weekly gains. Crypto expert asks Ripple CTO how the stablecoin will benefit the XRP Ledger and native token XRP. 

Read more

Forex MAJORS

Cryptocurrencies

Signatures