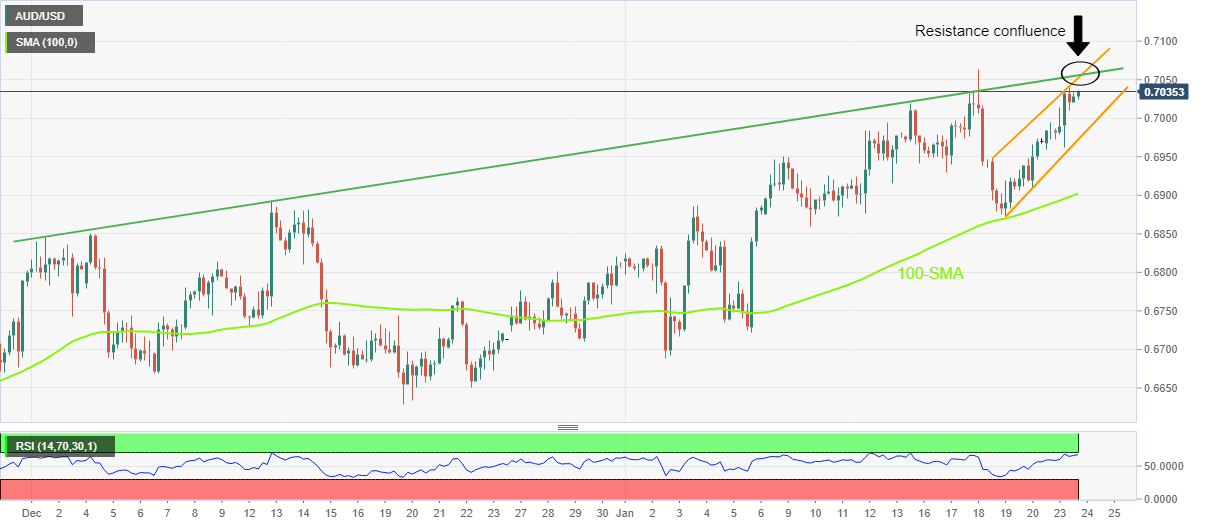
AUD/USD Price Analysis: Further upside needs validation from 0.7050-55 resistance confluence


  • AUD/USD picks up bids to renew intraday high during three-day uptrend.
  • Convergence of one-week-old bullish channel’s top line, ascending trend line from December 01 challenge buyers.
  • Nearly overbought RSI restricts further upside of the Aussie pair.
  • Bears remain off the table unless witnessing clear downside break of 100-SMA.

AUD/USD bulls keep the reins for the third consecutive day around 0.7030-35 during early Tuesday. In doing so, the Aussie pair stays inside a one-week-long ascending trend channel while justifying a firmer RSI (14).

It should be noted, however, that a seven-week-old upward-sloping resistance line joins the stated bullish channel’s top line near 0.7050-55 to pose a serious threat to the current advances.

Adding strength to the fears of the AUD/USD bulls is the RSI (14) line that approaches the overbought territory and suggests a pullback.

In a case where the Aussie buyers manage to cross the 0.7055 resistance confluence, the previous weekly high near 0.7065 may act as the last defense of the bears before directing the quote towards the August 2022 peak surrounding 0.7140.

Alternatively, pullback moves may initially aim for the 0.7000 psychological magnet and remain less harmful to the bullish trend unless breaking the short-term rising channel’s support line, close to 0.6970 at the latest.

Following that, the 100-SMA and the previous monthly high could challenge the AUD/USD pair sellers around 0.6900 and 0.6890 in that order before giving them control.

AUD/USD: Four-hour chart

Trend: Limited upside expected

Additional important levels

Overview
Today last price 0.7036
Today Daily Change 0.0010
Today Daily Change % 0.14%
Today daily open 0.7026
 
Trends
Daily SMA20 0.6875
Daily SMA50 0.6786
Daily SMA100 0.6643
Daily SMA200 0.6818
 
Levels
Previous Daily High 0.704
Previous Daily Low 0.696
Previous Weekly High 0.7064
Previous Weekly Low 0.6872
Previous Monthly High 0.6893
Previous Monthly Low 0.6629
Daily Fibonacci 38.2% 0.7009
Daily Fibonacci 61.8% 0.699
Daily Pivot Point S1 0.6978
Daily Pivot Point S2 0.6929
Daily Pivot Point S3 0.6898
Daily Pivot Point R1 0.7058
Daily Pivot Point R2 0.7089
Daily Pivot Point R3 0.7137


Share: Feed news

Information on these pages contains forward-looking statements that involve risks and uncertainties. Markets and instruments profiled on this page are for informational purposes only and should not in any way come across as a recommendation to buy or sell in these assets. You should do your own thorough research before making any investment decisions. FXStreet does not in any way guarantee that this information is free from mistakes, errors, or material misstatements. It also does not guarantee that this information is of a timely nature. Investing in Open Markets involves a great deal of risk, including the loss of all or a portion of your investment, as well as emotional distress. All risks, losses and costs associated with investing, including total loss of principal, are your responsibility. The views and opinions expressed in this article are those of the authors and do not necessarily reflect the official policy or position of FXStreet nor its advertisers. The author will not be held responsible for information that is found at the end of links posted on this page.

If not otherwise explicitly mentioned in the body of the article, at the time of writing, the author has no position in any stock mentioned in this article and no business relationship with any company mentioned. The author has not received compensation for writing this article, other than from FXStreet.

FXStreet and the author do not provide personalized recommendations. The author makes no representations as to the accuracy, completeness, or suitability of this information. FXStreet and the author will not be liable for any errors, omissions or any losses, injuries or damages arising from this information and its display or use. Errors and omissions excepted.

The author and FXStreet are not registered investment advisors and nothing in this article is intended to be investment advice.

Recommended content


Recommended content

Editors’ Picks

EUR/USD clings to daily gains above 1.0650

EUR/USD clings to daily gains above 1.0650

EUR/USD gained traction and turned positive on the day above 1.0650. The improvement seen in risk mood following the earlier flight to safety weighs on the US Dollar ahead of the weekend and helps the pair push higher.

EUR/USD News

GBP/USD recovers toward 1.2450 after UK Retail Sales data

GBP/USD recovers toward 1.2450 after UK Retail Sales data

GBP/USD reversed its direction and advanced to the 1.2450 area after touching a fresh multi-month low below 1.2400 in the Asian session. The positive shift seen in risk mood on easing fears over a deepening Iran-Israel conflict supports the pair.

GBP/USD News

Gold holds steady at around $2,380 following earlier spike

Gold holds steady at around $2,380 following earlier spike

Gold stabilized near $2,380 after spiking above $2,400 with the immediate reaction to reports of Israel striking Iran. Meanwhile, the pullback seen in the US Treasury bond yields helps XAU/USD hold its ground.

Gold News

Bitcoin Weekly Forecast: BTC post-halving rally could be partially priced in Premium

Bitcoin Weekly Forecast: BTC post-halving rally could be partially priced in

Bitcoin price shows no signs of directional bias while it holds above  $60,000. The fourth BTC halving is partially priced in, according to Deutsche Bank’s research. 

Read more

Week ahead – US GDP and BoJ decision on top of next week’s agenda

Week ahead – US GDP and BoJ decision on top of next week’s agenda

US GDP, core PCE and PMIs the next tests for the Dollar. Investors await BoJ for guidance about next rate hike. EU and UK PMIs, as well as Australian CPIs also on tap.

Read more

Forex MAJORS

Cryptocurrencies

Signatures