|

AUD/USD Price Analysis: Further upside hinges on 0.7045-50 resistance break, RBA

  • AUD/USD remains sidelined after refreshing six-week high, mildly bid of late.
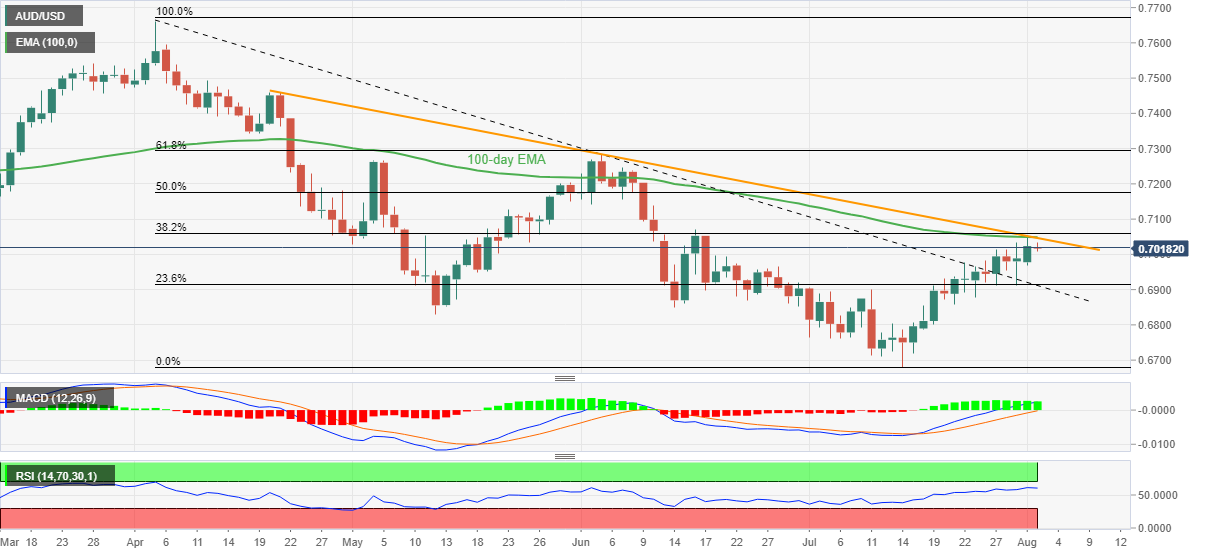
  • A convergence of 100-day EMA, descending trend line from late April restricts immediate upside.
  • Four-month-old previous resistance line could lure bears during pullback.
  • MACD, RSI conditions favor buyers but it all depends upon the RBA.

AUD/USD takes rounds to 0.7025-30 during the mid-Asian session on Tuesday. In doing so, the Aussie pair flirts with the key hurdle to the north as traders await the Reserve Bank of Australia’s (RBA) Interest Rate Decision.

In addition to a joint of the 100-day EMA and the downward sloping trend line from April 20, fears that the RBA might refrain from too hawkish commentary due to the broad recession fears also challenge the AUD/USD bulls.

Also read: AUD/USD bulls take a breather below 0.7050 ahead of RBA Interest Rate Decision

It’s worth noting, however, that the first MACD signals and the RSI (14), not overbought, keep AUD/USD buyers hopeful. On the same line is the Aussie pair’s sustained trading beyond the downward sloping resistance line from April, now support around 0.6910.

Should the pullback moves drag the quote below 0.6910, the lows marked during mid-June and May, respectively around 0.6850 and 0.6830, will challenge the pair’s further downside before redirecting bears towards the yearly low of 0.6680.

On the contrary, a successful run-up beyond the 0.7050 hurdle needs validation from June 16 swing high near 0.7070 before fueling the AUD/USD prices towards 50% and 61.8% Fibonacci retracement levels of the April-July downtrend, close to 0.7175 and 0.7300 in that order.

AUD/USD: Daily chart

Trend: Further Upside expected

Additional important levels

Overview
Today last price0.7024
Today Daily Change0.0005
Today Daily Change %0.07%
Today daily open0.7019
 
Trends
Daily SMA200.6871
Daily SMA500.6969
Daily SMA1000.7121
Daily SMA2000.7173
 
Levels
Previous Daily High0.7048
Previous Daily Low0.6968
Previous Weekly High0.7033
Previous Weekly Low0.6879
Previous Monthly High0.7033
Previous Monthly Low0.668
Daily Fibonacci 38.2%0.7017
Daily Fibonacci 61.8%0.6999
Daily Pivot Point S10.6975
Daily Pivot Point S20.6932
Daily Pivot Point S30.6895
Daily Pivot Point R10.7055
Daily Pivot Point R20.7092
Daily Pivot Point R30.7135

Author

Anil Panchal

Anil Panchal

FXStreet

Anil Panchal has nearly 15 years of experience in tracking financial markets. With a keen interest in macroeconomics, Anil aptly tracks global news/updates and stays well-informed about the global financial moves and their implications.

More from Anil Panchal
Share:

Editor's Picks

EUR/USD weakens below 1.1900, USD remains firm

EUR/USD has slipped back into its downtrend, drifting below the 1.1900 support as the US Dollar’s recovery keeps gathering traction. Indeed, the Greenback’s push higher gathered pace after President Trump named Kevin Warsh as Jerome Powell’s successor and US Producer Prices rose more than expected in December.

GBP/USD retreats further, threatens 1.3700

Selling pressure remains on the rise, dragging GBP/USD back towards three-day lows around 1.3720-1.3710 at the end of the week. Cable’s retracement reflects a firmer rebound in the Greenback as investors digest Trump’s announcement of the next Fed chair.

Gold remains offered just above $5,000

Gold is extending its pullback, managing to trim part of its strong losses and regain the $5,000 mark and beyond on Friday. The precious metal’s severe drop comes amid broad-based profit-taking across the commodity space, alongside a firmer US Dollar and mixed US Treasury yields.

Stellar deepens correction, slipping to 3-month low as risk-off mood persists

Stellar continues to trade in the red, slipping below $0.20 on Friday, a level not seen since mid-October. Bearish sentiment intensifies amid falling Open Interest and negative funding rates in the derivatives market. On the technical side, weakening momentum indicators support further correction in XLM.

Microsoft sell-off etches $400 billion hole in market, second highest on record

Microsoft's (MSFT) post-earnings cratering on Thursday sent other indices into pullback mode despite the narrow nature of its weakness.

Top 3 Price Prediction: Bitcoin, Ethereum, Ripple deepen sell-off as bears take control of momentum

Bitcoin, Ethereum, and Ripple continued their corrections on Friday, posting weekly losses of nearly 6%, 3%, and 5%, respectively. BTC is nearing the November lows at $80,000, while ETH slips below $2,800 amid increasing downside pressure.