|

AUD/USD Price Analysis: Extends pullback from 200-EMA towards 0.6560 support confluence

  • AUD/USD holds lower grounds around intraday low while snapping two-day uptrend.
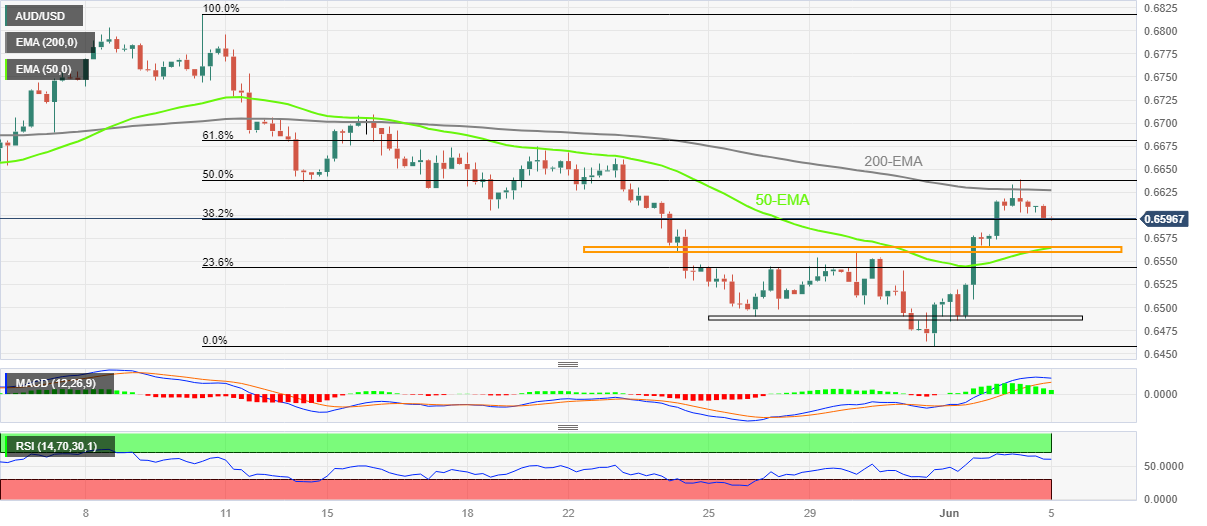
  • RSI (14) line’s retreat from overbought territory joins U-turn from 200-EMA to lure Aussie sellers.
  • Convergence of 50-EMA, one-week-old horizontal support zone challenges intraday sellers.

AUD/USD licks its wounds around the intraday low of 0.6595 while printing the first daily loss in three amid Monday’s mid-Asian session. In doing so, the Aussie pair keeps the previous day’s retreat from the 200-bar Exponential Moving Average (EMA).

Adding strength to the downside bias is the RSI (14) line’s U-turn from the overbought territory, as well as the receding bullish bias of the MACD indicator.

However, a convergence of the 50-EMA and multiple levels marked since May 24, around 0.6565-60, appears a tough nut to crack for the AUD/USD bears.

In a case where the Aussie pair drops below 0.6560, a quick drop towards another key horizontal support zone surrounding 0.6490, comprising levels marked in the last week, can’t be ruled out.

It’s worth observing though that the AUD/USD pair’s weakness past 0.6490 needs validation from the previous monthly low of around 0.6460 to keep the bears on board.

On the contrary, AUD/USD recovery remains elusive below the 200-EMA hurdle surrounding 0.6630.

Also acting as upside filters are 50% and 61.8% Fibonacci retracements of the pair’s May 10-31 downside, respectively near 0.6640 and 0.6680.

Overall, AUD/USD remains on the back foot but the downside room appears limited.

AUD/USD: Four-hour chart

Trend: Limited downside expected

Additional important levels

Overview
Today last price0.6596
Today Daily Change-0.0014
Today Daily Change %-0.21%
Today daily open0.661
 
Trends
Daily SMA200.6626
Daily SMA500.6664
Daily SMA1000.6755
Daily SMA2000.6695
 
Levels
Previous Daily High0.6639
Previous Daily Low0.6565
Previous Weekly High0.6639
Previous Weekly Low0.6458
Previous Monthly High0.6818
Previous Monthly Low0.6458
Daily Fibonacci 38.2%0.6611
Daily Fibonacci 61.8%0.6593
Daily Pivot Point S10.6571
Daily Pivot Point S20.6531
Daily Pivot Point S30.6497
Daily Pivot Point R10.6644
Daily Pivot Point R20.6678
Daily Pivot Point R30.6718

Author

Anil Panchal

Anil Panchal

FXStreet

Anil Panchal has nearly 15 years of experience in tracking financial markets. With a keen interest in macroeconomics, Anil aptly tracks global news/updates and stays well-informed about the global financial moves and their implications.

More from Anil Panchal
Share:

Markets move fast. We move first.

Orange Juice Newsletter brings you expert driven insights - not headlines. Every day on your inbox.

By subscribing you agree to our Terms and conditions.

Editor's Picks

EUR/USD climbs toward 1.1800 on broad USD weakness

EUR/USD gathers bullish momentum and advances toward 1.1800 in the second half of the day on Tuesday. The US Dollar weakens and helps the pair stretch higher after the employment report showed that Nonfarm Payrolls declined by 105,000 in October before rising by 64,000 in November.

GBP/USD climbs to fresh two-month high above 1.3400

GBP/USD gains traction in the American session and trades at its highest level since mid-October above 1.3430. The British Pound benefits from upbeat PMI data, while the US Dollar struggles to find demand following the mixed employment figures and weaker-than-forecast PMI prints, allowing the pair to march north.

Gold extends its consolidative phase around $4,300

Gold trades in positive above $4,300 after spending the first half of the day under bearish pressure. XAU/USD capitalizes on renewed USD weakness after the jobs report showed that the Unemployment Rate climbed to 4.6% in November and the PMI data revealed a loss of growth momentum in the private sector in December. 

US Retail Sales virtually unchanged at $732.6 billion in October

Retail Sales in the United States were virtually unchanged at $732.6 billion in October, the US Census Bureau reported on Tuesday. This print followed the 0.1% increase (revised from 0.3%) recorded in September and came in below the market expectation of +0.1%.

Ukraine-Russia in the spotlight once again

Since the start of the week, gold’s price has moved lower, but has yet to erase the gains made last week. In today’s report we intend to focus on the newest round of peace talks between Russia and Ukraine, whilst noting the release of the US Employment data later on day and end our report with an update in regards to the tensions brewing in Venezuela.

BNB Price Forecast: BNB slips below $855 as bearish on-chain signals and momentum indicators turn negative

BNB, formerly known as Binance Coin, continues to trade down around $855 at the time of writing on Tuesday, after a slight decline the previous day. Bearish sentiment further strengthens as BNB’s on-chain and derivatives data show rising retail activity.