AUD/USD Price Analysis: Defends 200-HMA breakout inside rising wedge
- AUD/USD keeps early Asian bounce off 200-HMA inside a bearish chart pattern.
- Poised for further upside amid bullish MACD conditions, ability to stay past the key moving average.
- Sellers need to confirm bearish wedge breakdown to refresh yearly low.

AUD/USD holds onto the day-start gains around 0.7500, up 0.26% intraday, as European traders brace for Tuesday’s work. In doing so, the Aussie pair stays above 200-HMA while staying inside the bearish chart pattern, rising wedge, on the hourly play.
Given the quote’s sustained trading above 200-HMA and bullish MACD signals, AUD/USD prices are likely to defy the bearish chart pattern, with an upside break of the immediate resistance line near 0.7505.
Following that, last Wednesday’s top surrounding 0.7535 and the monthly high near the 0.7600 round figure could entertain the bulls.
However, the pair’s failures to stay beyond 0.7488 HMA support, backed by a confirmation of rising wedge bearish chart pattern, via downside break of 0.7470, won’t hesitate to refresh the yearly low surrounding 0.7410.
It’s worth noting that highs marked during August-September 2020, around 0.7415, coupled with the 0.7400 psychological magnet, add filters to the downside.
AUD/USD hourly chart
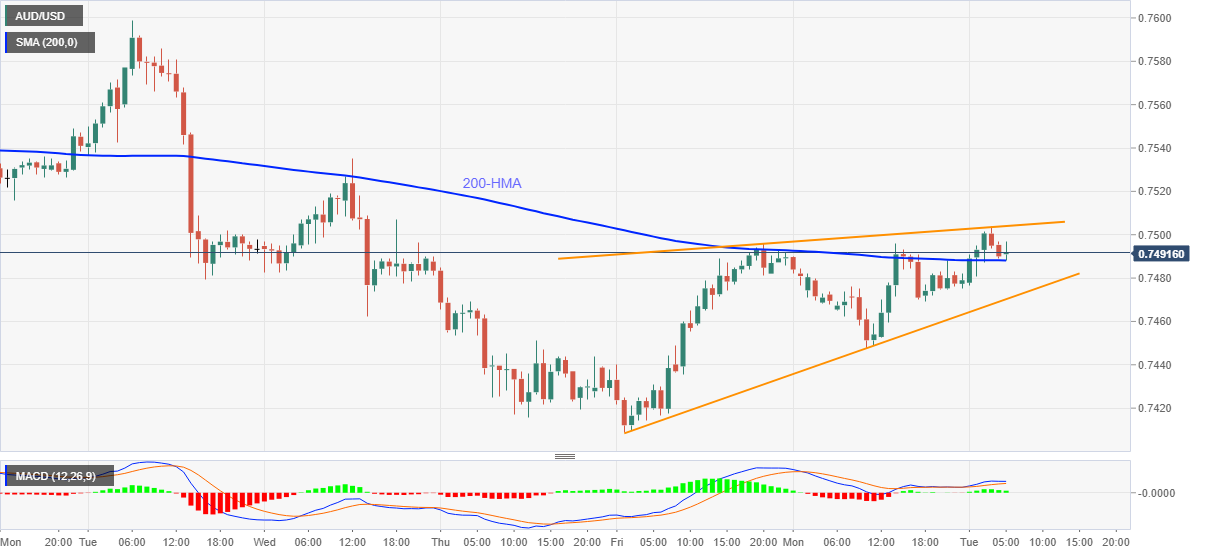
Trend: Further upside expected
Author

Anil Panchal
FXStreet
Anil Panchal has nearly 15 years of experience in tracking financial markets. With a keen interest in macroeconomics, Anil aptly tracks global news/updates and stays well-informed about the global financial moves and their implications.


