|

AUD/USD Price Analysis: Corrective bounce remains elusive below 0.6700

  • AUD/USD picks up bids to recover from fortnight-old horizontal support to snap two-day downtrend.
  • Short-term resistance line, 200-HMA prod immediate upside even as RSI rebound, bullish MACD signal favor intraday Aussie buyers.
  • One-week-long horizontal region act as the last defense of Aussie pair sellers.

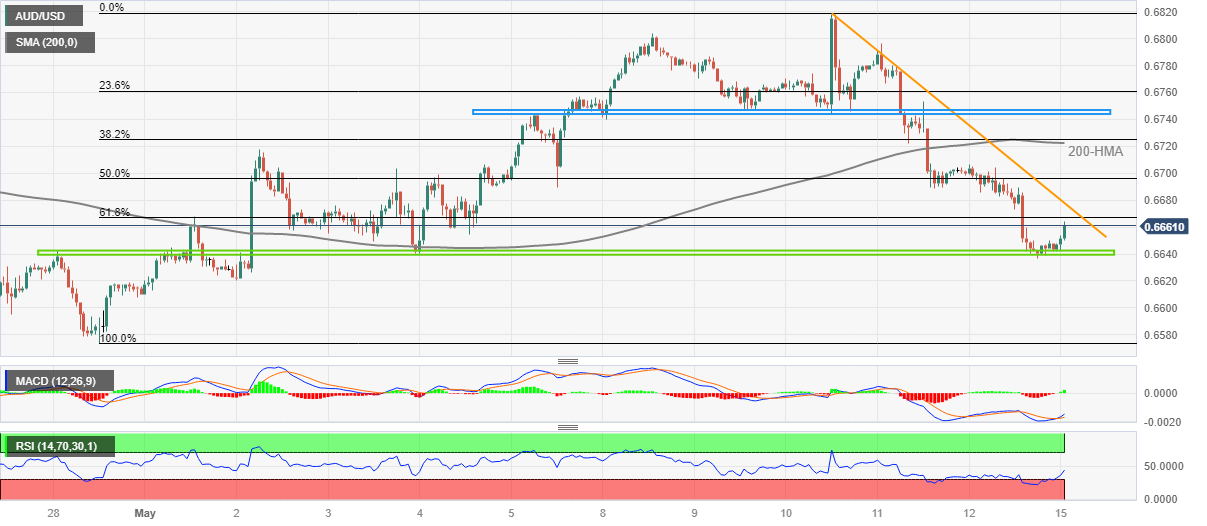
AUD/USD refreshes intraday high near 0.6665 as it bounces off short-term key support to print the first daily gains in three amid early Monday. In doing so, the Aussie pair also justifies the RSI (14) line’s rebound from the oversold territory.

It’s worth noting, that the bullish MACD signals also favor the AUD/USD pair’s U-turn from a two-week-old horizontal support zone surrounding 0.6640.

However, the 61.8% Fibonacci retracement level of the pair’s run-up from April 28 to May 10, close to 0.6670, precedes a downward-sloping resistance line from May 10, near 0.6680 at the latest, to restrict short-term AUD/USD rebound.

Even if the AUD/USD pair rises past 0.6680, the 200-HMA and a horizontal area comprising multiple levels marked since May 05, close to 0.6750, can challenge the buyers before giving them control.

Alternatively, a downside break of the aforementioned horizontal support near 0.6640 won’t hesitate to challenge the late April swing low of around 0.6575.

Following that, the yearly low marked in March around 0.6565 may act as an extra filter towards the south.

Overall, the AUD/USD pair is likely to keep the latest recovery but the upside room appears limited.

AUD/USD: Hourly chart

Trend: Limited recovery expected

additional important levels

Overview
Today last price0.6661
Today Daily Change0.0017
Today Daily Change %0.26
Today daily open0.6644
 
Trends
Daily SMA200.6691
Daily SMA500.6683
Daily SMA1000.679
Daily SMA2000.6724
 
Levels
Previous Daily High0.6706
Previous Daily Low0.6636
Previous Weekly High0.6818
Previous Weekly Low0.6636
Previous Monthly High0.6806
Previous Monthly Low0.6574
Daily Fibonacci 38.2%0.6663
Daily Fibonacci 61.8%0.668
Daily Pivot Point S10.6618
Daily Pivot Point S20.6592
Daily Pivot Point S30.6548
Daily Pivot Point R10.6688
Daily Pivot Point R20.6732
Daily Pivot Point R30.6758

Author

Anil Panchal

Anil Panchal

FXStreet

Anil Panchal has nearly 15 years of experience in tracking financial markets. With a keen interest in macroeconomics, Anil aptly tracks global news/updates and stays well-informed about the global financial moves and their implications.

More from Anil Panchal
Share:

Markets move fast. We move first.

Orange Juice Newsletter brings you expert driven insights - not headlines. Every day on your inbox.

By subscribing you agree to our Terms and conditions.

Editor's Picks

EUR/USD off three-month highs, holds near 1.1800 on softer US Dollar

EUR/USD consolidates gains below 1.1800 in the European trading hours on Wednesday. A broadly subdued US Dollar continues to underpin the pair amid quiet markets and thin liquidity conditions on Christmas Eve. 

GBP/USD keeps range around 1.3500 amid quiet markets

GBP/USD keeps its range trade intact at around 1.3500 in the European session on Wednesday. The Pound Sterling holds the upper hand over the US Dollar amid pre-Christmas light trading as traders turn to sidelines heading into the holiday season. 

Gold retreats from record highs amid profit-taking on Christmas Eve

Gold retreats following the move higher to the $4,525 area, or a fresh all-time peak, though the downside remains limited amid a bullish fundamental backdrop. The US Dollar selling bias remains unabated on the back of dovish Fed expectations, which continues to act as a tailwind for the bullion amid persistent geopolitical risks.

Shiba Inu's bears tighten grip, aiming for yearly lows

Shiba Inu price remains under pressure, trading below $0.000070 on Wednesday as bearish momentum continues to dominate the broader crypto market. On-chain and derivatives data further support the bearish sentiment, while technical analysis suggests a deeper correction targeting the yearly lows.

Economic outlook 2026-2027 in advanced countries: Solidity test

After a year marked by global economic resilience and ending on a note of optimism, 2026 looks promising and could be a year of solid economic performance. In our baseline scenario, we expect most of the supportive factors at work in 2025 to continue to play a role in 2026.

Stellar Price Forecast: XLM slips below $0.22 as bearish momentum builds

Stellar (XLM) price is trading below $0.22 at the time of writing on Wednesday after failing to close above the key resistance earlier this week. Bearish momentum continues to strengthen, with open interest falling and short bets rising.