AUD/USD Price Analysis: Bulls are moving in and eyes are on key structure
- AUD/USD bulls are stepping in within bearish territory.
- The Fibonacci scale has the 38.25 and 505 ratios lining up with stricture.

AUD/USD has been deteriorating for six straight trading days and has fallen into a void below 0.69 the figure and has been en route towards a weekly structure around 0.6780.
The following illustrates the market from a weekly and daily perspective and arrives at the potential for a meanwhile correction to the upside before mitigating the price imbalance to said level.
AUD/USD weekly chart
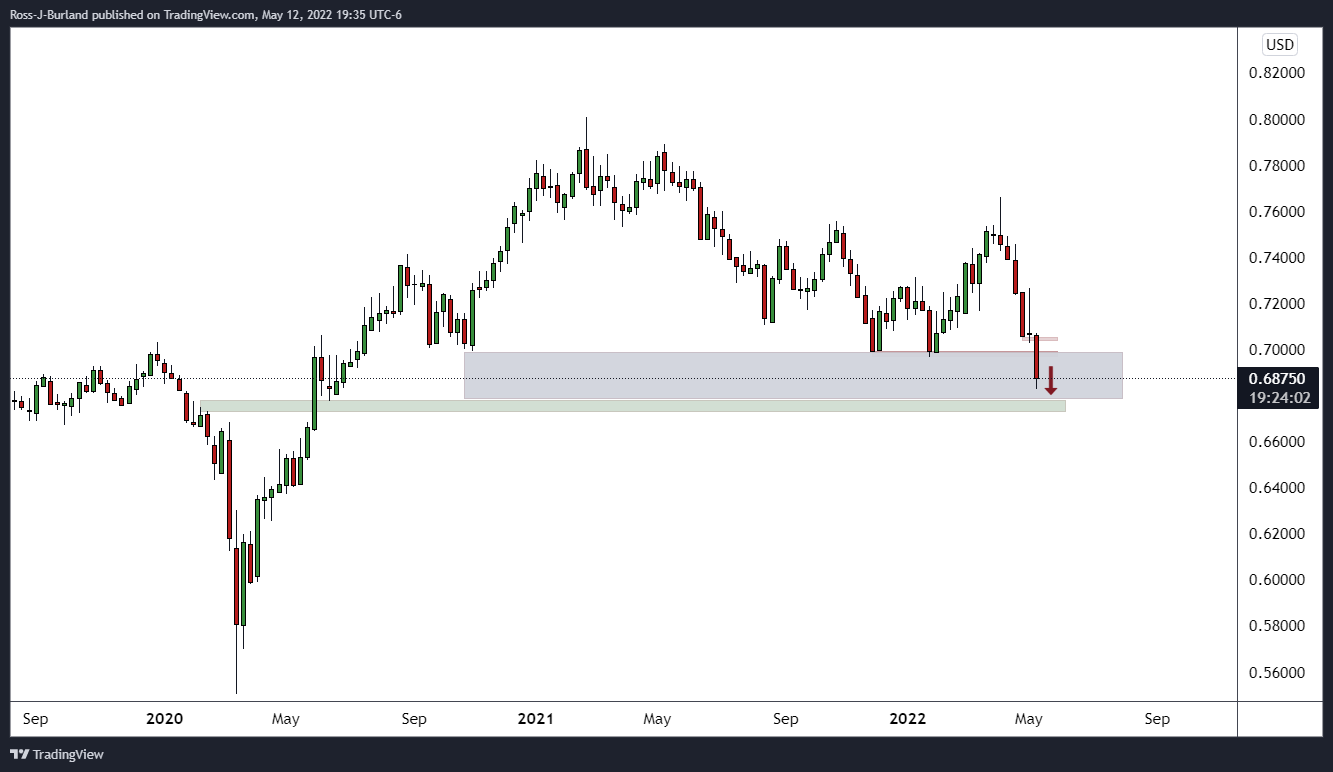
The weekly chart is highly bearish and the price is well on the way to the aforementioned weekly structure. However, from a daily perspective, there are prospects of bullish reaction:
AUD/USD daily chart
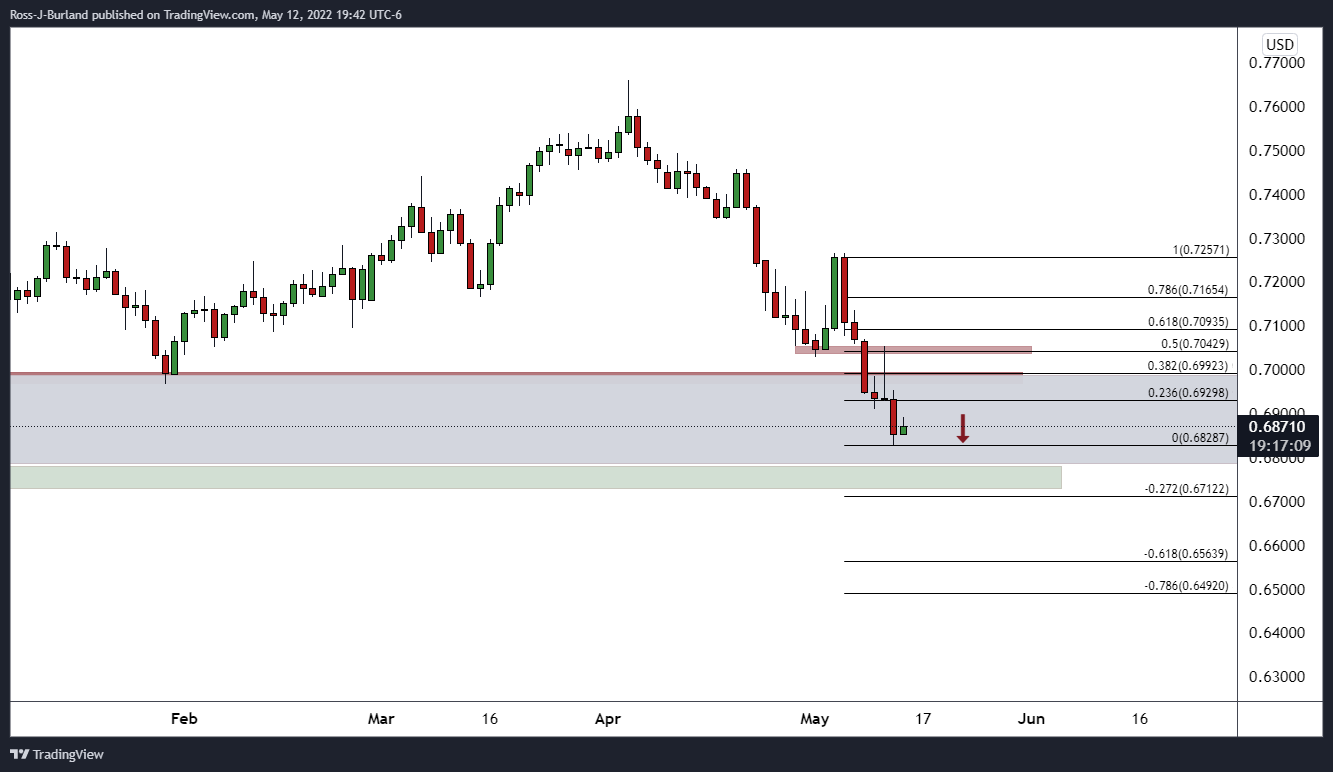
The price is already correcting and there are prospects of a move into the Fibonacci scale with 38.2% and the 50% ratios in areas of significance.
Author

Ross J Burland
FXStreet
Ross J Burland, born in England, UK, is a sportsman at heart. He played Rugby and Judo for his county, Kent and the South East of England Rugby team.


