|

AUD/USD Price Analysis: Bounces off previous resistance towards 0.6950

  • AUD/USD picks up bids to pare intraday losses, recovers from day’s low.
  • Three-week-old resistance-turned-support direct buyers towards a fortnight-old hurdle.
  • 200-SMA holds the key to bull’s return, sellers need validation from six-week-old ascending support line.

AUD/USD bears struggle to keep reins around 0.6930 even as it rebounds from the previous resistance line heading into Monday’s European session.

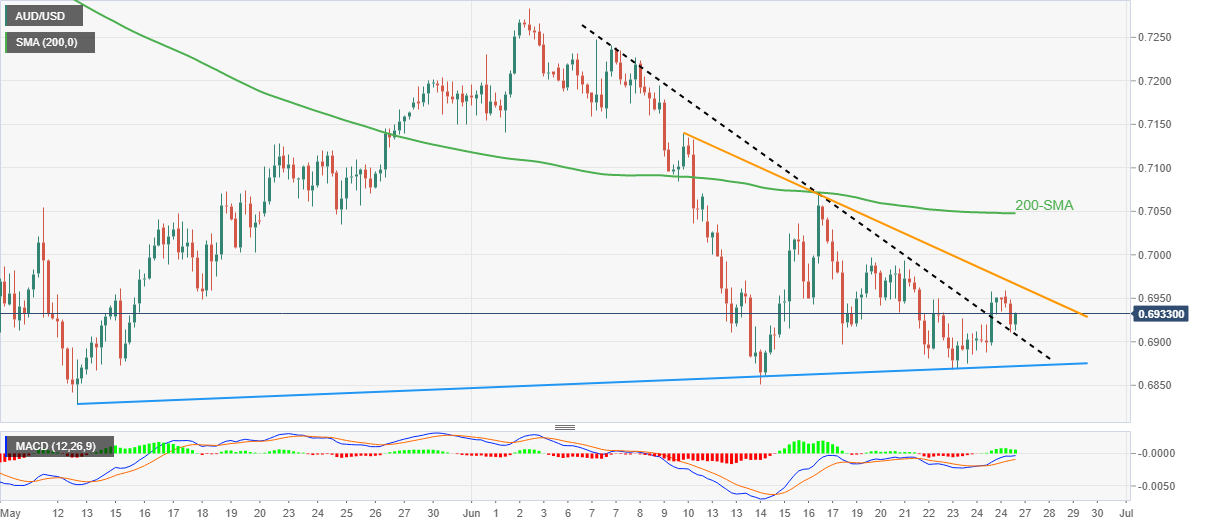
The Aussie pair’s recovery from the resistance-turned-support line from early June takes clues from the upbeat MACD signals. That said, buyers aim for the fortnight-long trend line resistance, at 0.6970 by the press time.

However, the quote’s upside past 0.6970 depends upon the ability to cross the 200-SMA level surrounding 0.7050. It should be noted that the 0.7000 psychological magnet appears to be the intermediate halt during the run-up beyond 0.6970.

On the flip side, a clear break below the previous resistance line, near 0.6910, will need validation from the 0.6900 round figure to convince AUD/USD bears.

Even so, an upward sloping trend line support from May 12, near 0.6870 by the press time, may challenge the AUD/USD bears before directing them to the yearly low near 0.6830.

Overall, AUD/USD remains on the bear’s radar even if short-term recovery remains on the table.

AUD/USD: Four-hour chart

Trend: Corrective pullback expected

Additional important levels

Overview
Today last price0.6932
Today Daily Change-0.0017
Today Daily Change %-0.24%
Today daily open0.6949
 
Trends
Daily SMA200.7064
Daily SMA500.709
Daily SMA1000.7213
Daily SMA2000.7233
 
Levels
Previous Daily High0.6958
Previous Daily Low0.6885
Previous Weekly High0.6997
Previous Weekly Low0.6868
Previous Monthly High0.7267
Previous Monthly Low0.6828
Daily Fibonacci 38.2%0.693
Daily Fibonacci 61.8%0.6913
Daily Pivot Point S10.6903
Daily Pivot Point S20.6858
Daily Pivot Point S30.683
Daily Pivot Point R10.6976
Daily Pivot Point R20.7004
Daily Pivot Point R30.7049

Author

Anil Panchal

Anil Panchal

FXStreet

Anil Panchal has nearly 15 years of experience in tracking financial markets. With a keen interest in macroeconomics, Anil aptly tracks global news/updates and stays well-informed about the global financial moves and their implications.

More from Anil Panchal
Share:

Editor's Picks

EUR/USD holds above 1.1750 after mixed EU PMI data

EUR/USD manages to hold above 1.1750 but struggles to gather recovery momentum on Friday, following the mixed February PMI figures from Germany and the Eurozone. In the second half of the day, Q4 GDP, December inflation and February PMI data from the US will be watched closely by market participants.

GBP/USD recovers further toward 1.3500 after UK PMI data

GBP/USD is recovering ground further toward 1.3500 in European trading on Friday, helped by a modest uptick in the Pound Sterling after stronger-than-expected UK January Retail Sales and February PMI data. However, the pair's further upside could be limited amid persistent US Dollar strength as the focus turns to key US data. 

Gold sticks to positive bias above $5,000 ahead of US data

Gold gains some positive traction for the third consecutive day on Friday. holding above $5,000. Traders now look forward to the key US macro releases – the Advance Q4 GDP report and the Personal Consumption Expenditures (PCE) Price Index – for fresh trading impetus. 

US GDP growth expected to slow down significantly in Q4 after stellar Q3 

The United States Bureau of Economic Analysis will publish the first preliminary estimate of the fourth-quarter Gross Domestic Product at 13:30 GMT. Analysts forecast the US economy to have expanded at a 3% annualized rate, slowing down from the 4.4% growth posted in the previous quarter.

Iran tensions and AI fears at the forefront ahead of key US data

Thursday’s scorecard shows major US Stock benchmarks closed modestly in the red amid mounting US-Iran tensions and AI disruption worries. The S&P 500 shed 19 points (0.3%) to 6,861, the Nasdaq 100 lost 101 points (0.4%) to 24,797, and the Dow Jones Industrial Average dropped 267 points (0.5%) to 49,395.

Official Trump price approaches breakout with mixed signals from traders

Official Trump (TRUMP) is trading at $3.50 at the time of writing, approaching its upper consolidation range. A breakout from this range could open the door for an upside move. On-chain data shows market indecision, with balanced flows between bulls and bears, signaling a lack of clear directional bias.