AUD/USD Price Analysis: Bears keep the reins near 0.6500 ahead of Aussie Retail Sales


Share:
  • AUD/USD stays depressed at the lowest levels since November 2022 after falling in the last three consecutive days.
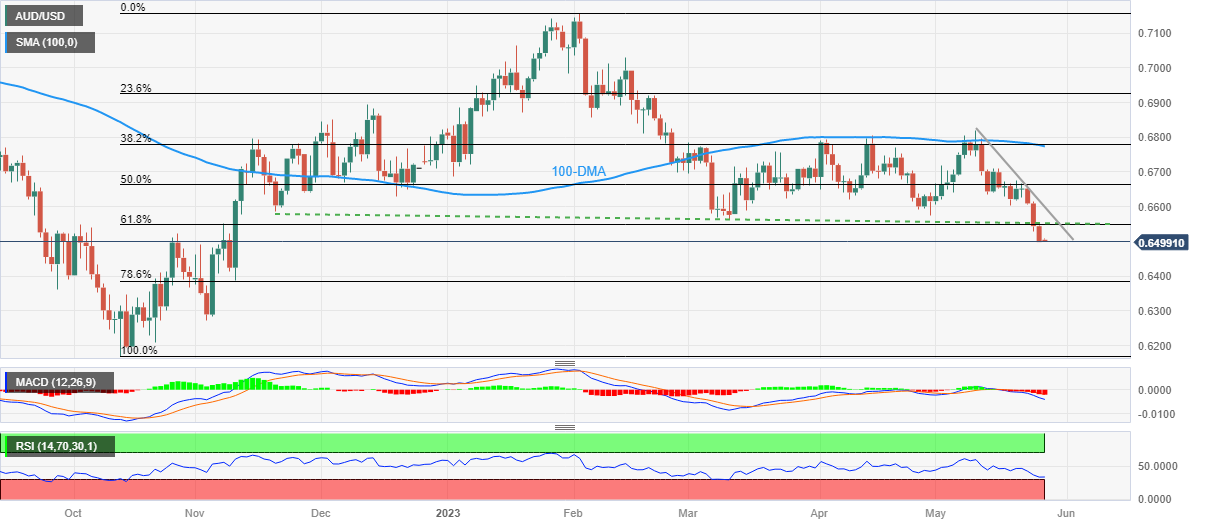
  • Break of six-month-old descending trend line, 61.8% Fibonacci retracement joins bearish MACD signals to lure sellers.
  • Oversold RSI, market’s consolidation amid US debt ceiling jitters prod Aussie pair sellers.
  • Australia Retail Sales growth expected to ease in April, may allow bears to refresh yearly low.

AUD/USD renews the lowest level in six months as it takes offers to 0.6500 during early Friday in Asia. In doing so, the Aussie pair bears the burden of the broad US Dollar strength, as well as downbeat hopes about the Australian Retail Sales data for April, likely to ease to 0.2% MoM versus 0.4% prior.

Technically, a daily closing below the 0.6550 support confluence, now resistance, joins the bearish MACD signals to keep the AUD/USD sellers hopeful. That said, a downward-sloping trend line from late November 2022 and a 61.8% Fibonacci retracement level of the AUD/USD pair’s run-up from October 2022 to February 2023 constitute the 0.6550 key upside hurdle.

Even if the Aussie pair manage to cross the 0.6550 resistance confluence, a fortnight-old falling resistance line, close to 0.6615 by the press time, can prod the buyers before giving them control.

Above all, AUD/USD remains on the bear’s radar until it provides a daily close beyond the 100-DMA level of 0.6775.

Meanwhile, the 78.6% Fibonacci retracement level of around 0.6385 appears the key support for the AUD/USD bears to watch amid the oversold RSI (14). Also acting as a downside filter is the 0.6400 round figure.

AUD/USD: Daily chart

Trend: Further downside expected

Additional important levels

Overview
Today last price 0.6498
Today Daily Change -0.0046
Today Daily Change % -0.70%
Today daily open 0.6544
 
Trends
Daily SMA20 0.6671
Daily SMA50 0.6684
Daily SMA100 0.678
Daily SMA200 0.6708
 
Levels
Previous Daily High 0.6615
Previous Daily Low 0.653
Previous Weekly High 0.671
Previous Weekly Low 0.6605
Previous Monthly High 0.6806
Previous Monthly Low 0.6574
Daily Fibonacci 38.2% 0.6562
Daily Fibonacci 61.8% 0.6583
Daily Pivot Point S1 0.6511
Daily Pivot Point S2 0.6477
Daily Pivot Point S3 0.6425
Daily Pivot Point R1 0.6596
Daily Pivot Point R2 0.6649
Daily Pivot Point R3 0.6682


Share: Feed news

Information on these pages contains forward-looking statements that involve risks and uncertainties. Markets and instruments profiled on this page are for informational purposes only and should not in any way come across as a recommendation to buy or sell in these assets. You should do your own thorough research before making any investment decisions. FXStreet does not in any way guarantee that this information is free from mistakes, errors, or material misstatements. It also does not guarantee that this information is of a timely nature. Investing in Open Markets involves a great deal of risk, including the loss of all or a portion of your investment, as well as emotional distress. All risks, losses and costs associated with investing, including total loss of principal, are your responsibility. The views and opinions expressed in this article are those of the authors and do not necessarily reflect the official policy or position of FXStreet nor its advertisers. The author will not be held responsible for information that is found at the end of links posted on this page.

If not otherwise explicitly mentioned in the body of the article, at the time of writing, the author has no position in any stock mentioned in this article and no business relationship with any company mentioned. The author has not received compensation for writing this article, other than from FXStreet.

FXStreet and the author do not provide personalized recommendations. The author makes no representations as to the accuracy, completeness, or suitability of this information. FXStreet and the author will not be liable for any errors, omissions or any losses, injuries or damages arising from this information and its display or use. Errors and omissions excepted.

The author and FXStreet are not registered investment advisors and nothing in this article is intended to be investment advice.

Follow us on Telegram

Stay updated of all the news

Join Telegram

Recommended content


Follow us on Telegram

Stay updated of all the news

Join Telegram

Recommended content

Editors’ Picks

EUR/USD clings to small daily gains above 1.0700

EUR/USD clings to small daily gains above 1.0700

EUR/USD has lost its traction after having climbed toward 1.0750 earlier in the day but managed to stabilize above 1.0700. Mixed performance of Wall Street's main indexes following the consumer confidence data helps the US Dollar hold its ground and caps the pair's upside.

EUR/USD News

GBP/USD retreats below 1.2400 as US Dollar rebounds

GBP/USD retreats below 1.2400 as US Dollar rebounds

GBP/USD has retraced a small portion of its daily rally and declined below 1.2400 in the American session on Tuesday. Following a bullish start to the day, major equity indexes lost traction and helped the US Dollar stage a rebound while weighing on the pair.

GBP/USD News

Gold: XAU/USD retakes $1,950 as investors hesitate Premium

Gold: XAU/USD retakes $1,950 as investors hesitate

Gold price has posted a nice comeback after bottoming for the day at $1,932 a troy ounce, now trading near a daily high of $1,963.48.

Gold News

Bitcoin whales could prevent BTC price first monthly loss of 2023 through this move

Bitcoin whales could prevent BTC price first monthly loss of 2023 through this move

Bitcoin price is inching towards the first monthly loss of 2023. At press time, BTC price is 4.4% below $29,233, its price on May 1. If BTC fails to regain lost ground, the asset is in for its first monthly loss of the year.

Read more

Tesla Stock News: TSLA breaks above $200 as Elon Musk visits China

Tesla Stock News: TSLA breaks above $200 as Elon Musk visits China

Tesla (TSLA) stock has overcome a major psychological barrier to start the week with shares overcoming the $200 level early Tuesday. A number of tailwinds are aiding the growth stock, which has gained 4.4% to $201.67 in the premarket.

Read more

Forex MAJORS

Cryptocurrencies

Signatures