AUD/USD Price Analysis: Approaches upper end of monthly bullish channel near 0.7150


  • AUD/USD braces for the biggest weekly gain since November 2020 inside one-month-old ascending trend channel.
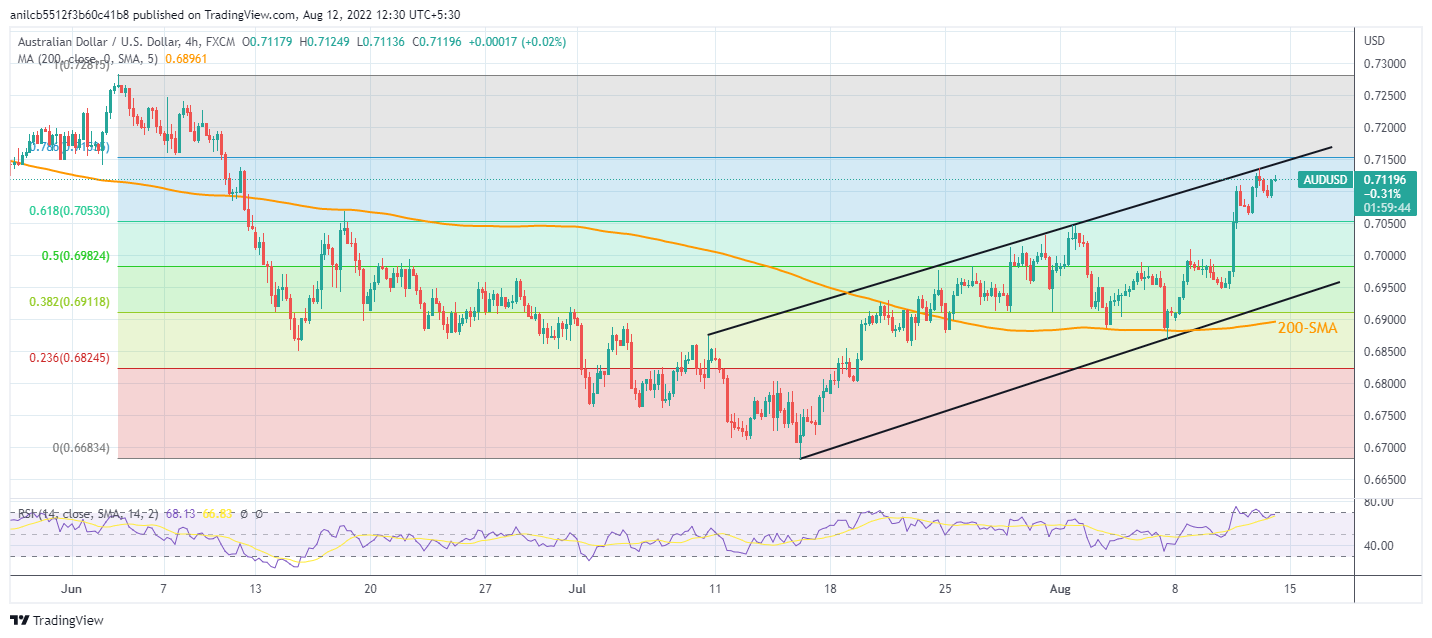
  • Overbought RSI conditions suggest pullback from the stated channel’s resistance.
  • 200-SMA holds the key for bear’s entry, bulls can aim for June’s peak beyond 0.7150 nearby hurdle.

AUD/USD grinds higher around intraday top surrounding 0.7125 heading into Friday’s European session. In doing so, the Aussie pair remains inside a one-month-old upward sloping bullish trend channel while rising for the third consecutive day.

It’s worth noting that the quote is near the upper end of the stated channel amid the nearly overbought RSI, which in turn suggests that the bulls are running out of steam while bracing for the biggest weekly gains since November 2020. This highlights the 0.7150 level for the bears.

However, the 50% Fibonacci retracement level of the June-July downside, near 0.6980, precedes the aforementioned channel’s support line, close to 0.6930, to challenge the AUD/USD downside.

Also acting as important support is the 200-SMA level surrounding 0.6895.

Alternatively, the AUD/USD pair’s successful run-up beyond the 0.7150 hurdle will have to cross the 78.6% Fibonacci retracement level of 0.7155 to direct the bulls towards June’s peak of 0.7282.

Overall, AUD/USD is on the bull’s radar but may witness a pullback.

AUD/USD: Four-hour chart

Trend: Limited upside expected

Additional important levels

Overview
Today last price 0.7122
Today Daily Change 0.0016
Today Daily Change % 0.23%
Today daily open 0.7106
 
Trends
Daily SMA20 0.6951
Daily SMA50 0.6942
Daily SMA100 0.7088
Daily SMA200 0.7153
 
Levels
Previous Daily High 0.7137
Previous Daily Low 0.6963
Previous Weekly High 0.7048
Previous Weekly Low 0.6869
Previous Monthly High 0.7033
Previous Monthly Low 0.668
Daily Fibonacci 38.2% 0.707
Daily Fibonacci 61.8% 0.7029
Daily Pivot Point S1 0.7
Daily Pivot Point S2 0.6894
Daily Pivot Point S3 0.6826
Daily Pivot Point R1 0.7174
Daily Pivot Point R2 0.7243
Daily Pivot Point R3 0.7348


Share: Feed news

Information on these pages contains forward-looking statements that involve risks and uncertainties. Markets and instruments profiled on this page are for informational purposes only and should not in any way come across as a recommendation to buy or sell in these assets. You should do your own thorough research before making any investment decisions. FXStreet does not in any way guarantee that this information is free from mistakes, errors, or material misstatements. It also does not guarantee that this information is of a timely nature. Investing in Open Markets involves a great deal of risk, including the loss of all or a portion of your investment, as well as emotional distress. All risks, losses and costs associated with investing, including total loss of principal, are your responsibility. The views and opinions expressed in this article are those of the authors and do not necessarily reflect the official policy or position of FXStreet nor its advertisers. The author will not be held responsible for information that is found at the end of links posted on this page.

If not otherwise explicitly mentioned in the body of the article, at the time of writing, the author has no position in any stock mentioned in this article and no business relationship with any company mentioned. The author has not received compensation for writing this article, other than from FXStreet.

FXStreet and the author do not provide personalized recommendations. The author makes no representations as to the accuracy, completeness, or suitability of this information. FXStreet and the author will not be liable for any errors, omissions or any losses, injuries or damages arising from this information and its display or use. Errors and omissions excepted.

The author and FXStreet are not registered investment advisors and nothing in this article is intended to be investment advice.

Recommended content


Recommended content

Editors’ Picks

EUR/USD clings to daily gains above 1.0650

EUR/USD clings to daily gains above 1.0650

EUR/USD gained traction and turned positive on the day above 1.0650. The improvement seen in risk mood following the earlier flight to safety weighs on the US Dollar ahead of the weekend and helps the pair push higher.

EUR/USD News

GBP/USD recovers toward 1.2450 after UK Retail Sales data

GBP/USD recovers toward 1.2450 after UK Retail Sales data

GBP/USD reversed its direction and advanced to the 1.2450 area after touching a fresh multi-month low below 1.2400 in the Asian session. The positive shift seen in risk mood on easing fears over a deepening Iran-Israel conflict supports the pair.

GBP/USD News

Gold holds steady at around $2,380 following earlier spike

Gold holds steady at around $2,380 following earlier spike

Gold stabilized near $2,380 after spiking above $2,400 with the immediate reaction to reports of Israel striking Iran. Meanwhile, the pullback seen in the US Treasury bond yields helps XAU/USD hold its ground.

Gold News

Bitcoin Weekly Forecast: BTC post-halving rally could be partially priced in Premium

Bitcoin Weekly Forecast: BTC post-halving rally could be partially priced in

Bitcoin price shows no signs of directional bias while it holds above  $60,000. The fourth BTC halving is partially priced in, according to Deutsche Bank’s research. 

Read more

Week ahead – US GDP and BoJ decision on top of next week’s agenda

Week ahead – US GDP and BoJ decision on top of next week’s agenda

US GDP, core PCE and PMIs the next tests for the Dollar. Investors await BoJ for guidance about next rate hike. EU and UK PMIs, as well as Australian CPIs also on tap.

Read more

Forex MAJORS

Cryptocurrencies

Signatures