AUD/NZD Technical Analysis: 2-week old support-line continues to favor bulls

Despite witnessing pullbacks from 1.0610, the AUD/NZD pair bounced off the fortnight-long upward sloping support-line and is presently trading around 1.0590 during early Friday.
The quote has been closely following the aforementioned trend-line that favors buyers targeting 200-day simple moving average (SMA) level on the daily chart, near 1.0695/1.0700.
Though, recent highs of 1.0610 and January month top surrounding 1.0670 may offer intermediate halts to the rise toward 1.0700.
Meanwhile, a downside break of 1.0570 support might not hesitate to drag the quote to 23.6% Fibonacci retracement of its upside since March 25 near 1.0530.
Additionally, 1.0490 and 1.0450 may provide buffer stops to prices whereas 61.8% Fibonacci retracement at 1.0400 could question the bears afterward.
AUD/NZD 4-Hour chart
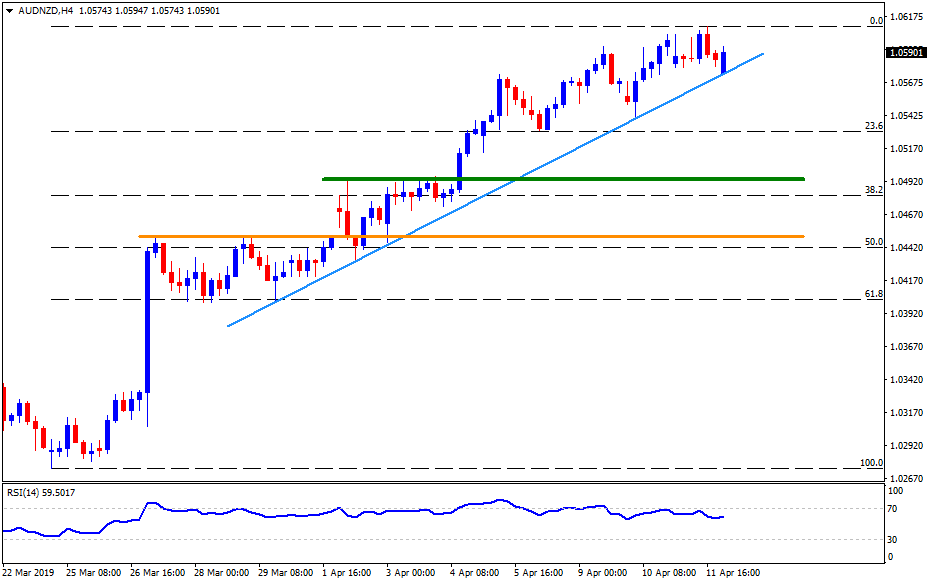
Trend: Bullish
Author

Anil Panchal
FXStreet
Anil Panchal has nearly 15 years of experience in tracking financial markets. With a keen interest in macroeconomics, Anil aptly tracks global news/updates and stays well-informed about the global financial moves and their implications.


