|

AUD/NZD Price Analysis: Bulls waiting to pounce

  • AUD/NZD bulls are in accumilaiton at this juncture. 
  • Bulls look to the M-formation's neckline and await breakout signals. 

As per the prior analysis, AUD/NZD Price Analysis: Traders, don't get caught out! the price is indeed showing all the signs that the downside is tiring. The following analysis illustrates the prospects of a retracement to the neckline of the daily M-formation. Additionally, we can start to see price action that resembles the Wycoff method in the accumulation phase. 

AUD/NZD daily chart

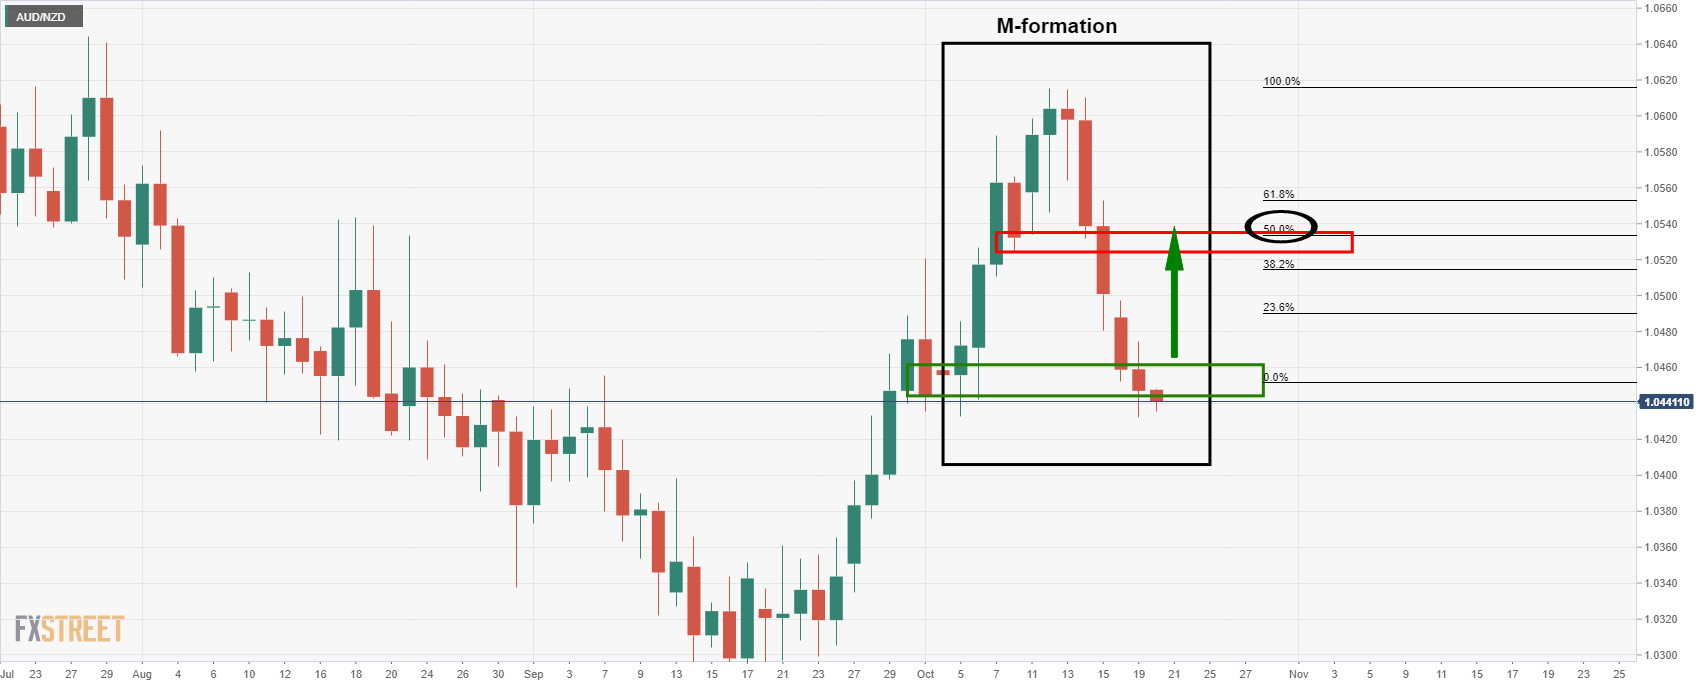
The M-formation is a bullish reversion pattern that would be expected to draw in the price for a test of the formation's neckline. In this case, that level is the 8 Oct low at 1.0524. 

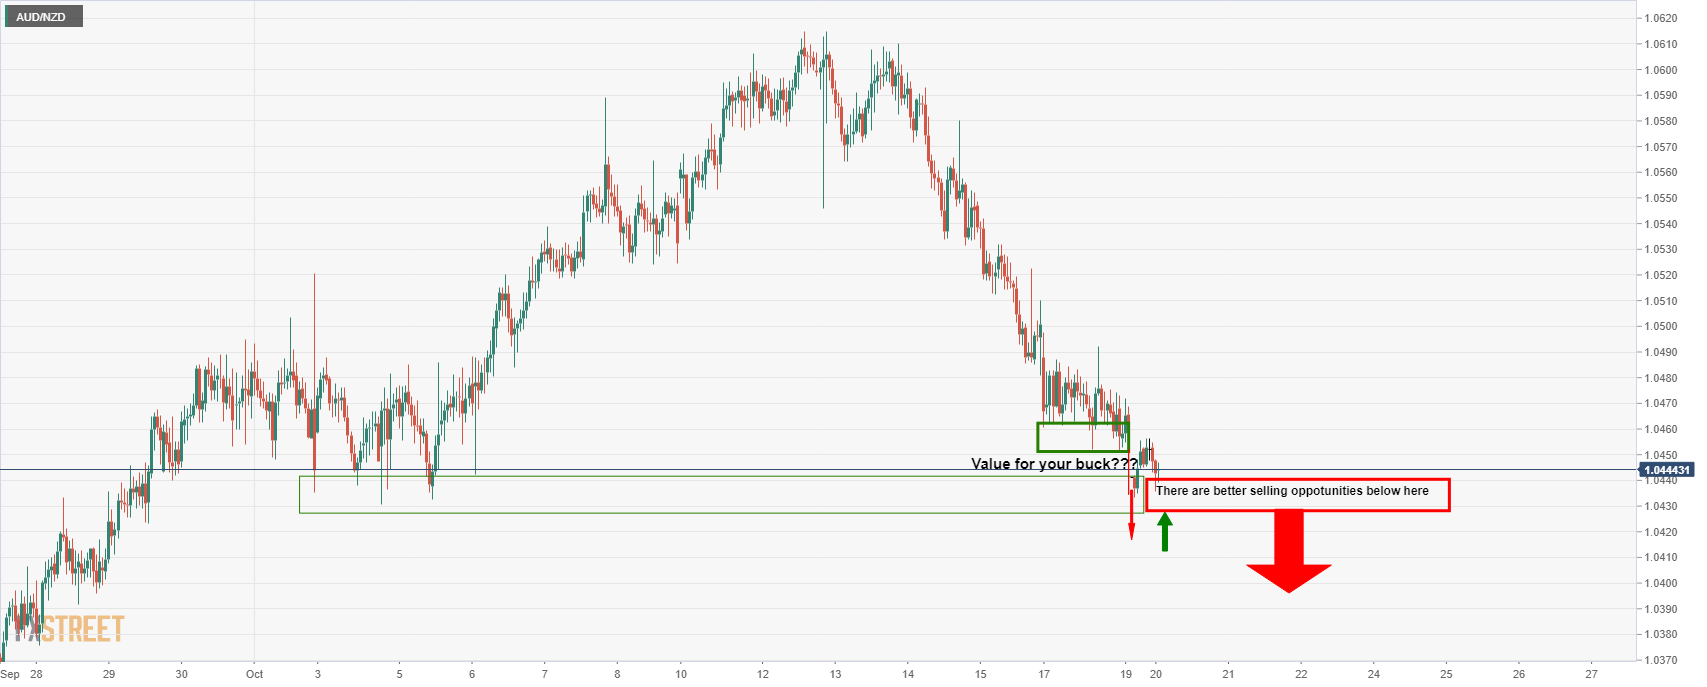
AUD/NZD hourly chart

While in the prior session's analysis, from an hourly perspective, the price went against the core projection. The expectations were for a move higher from the lower low. However, the door was left open for a test of the support zone between 1.0420/30 which has played out as follows:

This brings us to the Wycoff Method: 

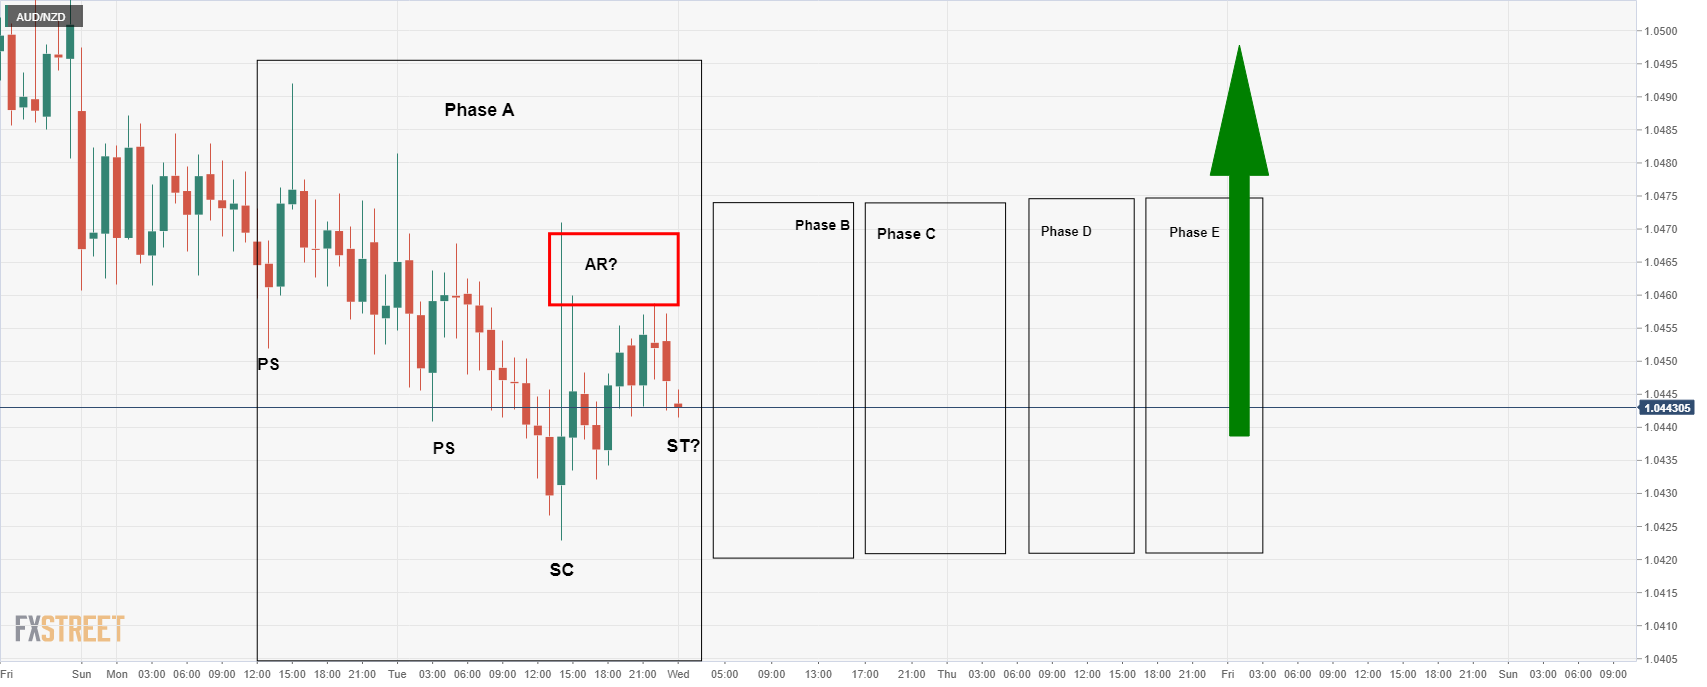
The Wycoff accumulation methodology is a long-winded process but we have already seen Phase A potentially play out...

Author

Ross J Burland

Ross J Burland, born in England, UK, is a sportsman at heart. He played Rugby and Judo for his county, Kent and the South East of England Rugby team.

More from Ross J Burland
Share:

Editor's Picks

EUR/USD stays well offered below 1.1800

The selling pressure on EUR/USD is picking up pace, with the pair slipping decisively below the key 1.1800 level and sliding to fresh two week lows as Wednesday’s session draws to a close. The move lower comes as the US Dollar finds renewed strength after the latest round of US data and the release of the FOMC Minutes. Next of note on the docket will be the US weekly Initial Jobless Claims.
 

GBP/USD reaches multi-day lows near 1.3500

GBP/USD reverses its initial upside momentum and is now adding to previous declines, approaching the 1.3500 region on Wednesday. Cable’s downtick comes on the back of decent gains in the Greenback and easing UK inflation figures, which seem to have reinforced the case for a BoE rate cut in March.

Gold battle to regain $5,000 continues

Gold is back on the front foot on Wednesday, shaking off part of the early week softness and challenging two-day highs near the $5,000 mark per troy ounce. The move comes ahead of the FOMC Minutes and is unfolding despite an intense rebound in the US Dollar.

Bitcoin has found or is near a bottom, extended consolidation to follow: K33

Bitcoin (BTC) is nearing or has already established a bottom, which could be followed by a sustained period of slow price movement, according to K33.

Mixed UK inflation data no gamechanger for the Bank of England

Food inflation plunged in January, but service sector price pressure is proving stickier. We continue to expect Bank of England rate cuts in March and June. The latest UK inflation read is a mixed bag for the Bank of England, but we doubt it drastically changes the odds of a March rate cut.

Sui extends sideways action ahead of Grayscale’s GSUI ETF launch

Sui is extending its downtrend for the second consecutive day, trading at 0.95 at the time of writing on Wednesday. The Layer-1 token is down over 16% in February and approximately 34% from the start of the year, aligning with the overall bearish sentiment across the crypto market.