|

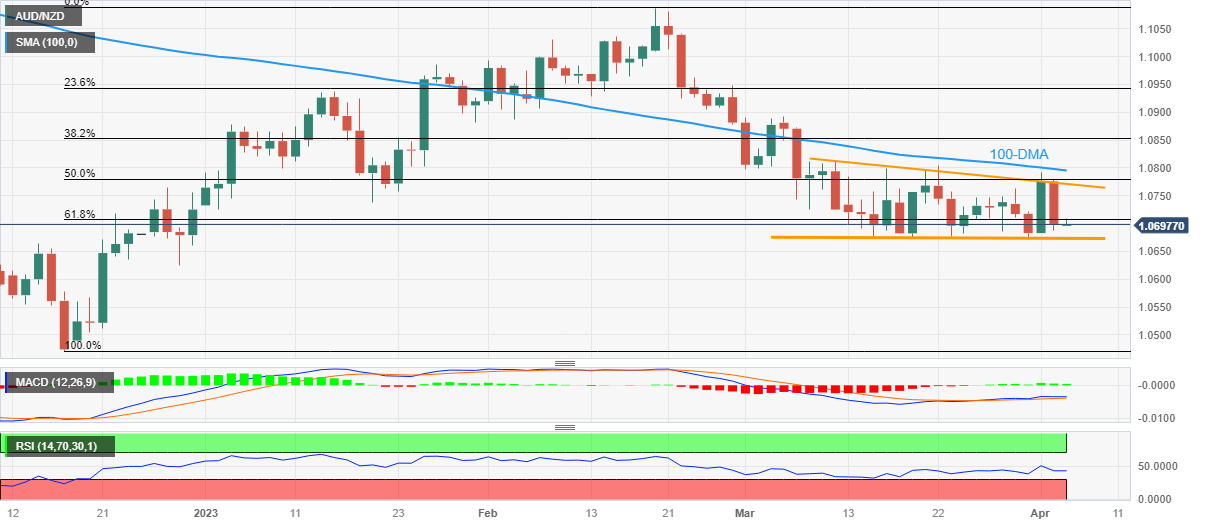
AUD/NZD Price Analysis: Bears approach 1.0670 key support with eyes on RBNZ

  • AUD/NZD holds lower ground after reversing from two-week high the previous day.
  • RBNZ is likely to increase benchmark rates by 0.25% but Rate Statement will be crucial to watch amid recent dovish bias.
  • One-month-old descending triangle restricts short-term moves amid sluggish MACD.
  • 100-DMA acts as an extra filter towards the north.

AUD/NZD remains pressured around 1.0700 as traders await the Reserve Bank of New Zealand (RBNZ) monetary policy decision on early Wednesday.

Also read: RBNZ Interest Rate Decision Preview: Hawkish guidance yet again?

The exotic pair dropped the most in a month the previous day while reversing from a resistance line of a one-month-old descending triangle formation.

It should be noted, however, that the sluggish MACD and unimpressive RSI (14) suggest that the AUD/NZD price may defend the triangle formation, which in turn hints at a limited downside room towards the stated pattern’s support line of near 1.0670 by the press time.

That said, the quote’s sustained trading below the 100-DMA and the 61.8% Fibonacci retracement of its December 2022 to February 2023 upside keeps it on the bear’s radar.

Hence, a downside break of 1.0670 won’t hesitate to target the late 2022 low of near 1.0470. Though, the 1.0600 and 1.0500 levels may act as intermediate halts during the expected fall.

On the flip side, a clear break of the triangle’s top line, close to 1.0775 at the latest, becomes necessary for the AUD/NZD buyers to get in.

Even so, the 50% Fibonacci retracement level and 100-DMA hurdles of 1.0780 and 1.0795 in that order can challenge the pair bulls before giving them control.

AUD/NZD: Daily chart

Trend: Further downside expected

Additional important levels

Overview
Today last price1.0699
Today Daily Change-0.0077
Today Daily Change %-0.71%
Today daily open1.0776
 
Trends
Daily SMA201.0735
Daily SMA501.086
Daily SMA1001.0801
Daily SMA2001.0967
 
Levels
Previous Daily High1.0792
Previous Daily Low1.0682
Previous Weekly High1.0763
Previous Weekly Low1.0672
Previous Monthly High1.0892
Previous Monthly Low1.0672
Daily Fibonacci 38.2%1.075
Daily Fibonacci 61.8%1.0724
Daily Pivot Point S11.0708
Daily Pivot Point S21.064
Daily Pivot Point S31.0598
Daily Pivot Point R11.0818
Daily Pivot Point R21.086
Daily Pivot Point R31.0928

Author

Anil Panchal

Anil Panchal

FXStreet

Anil Panchal has nearly 15 years of experience in tracking financial markets. With a keen interest in macroeconomics, Anil aptly tracks global news/updates and stays well-informed about the global financial moves and their implications.

More from Anil Panchal
Share:

Editor's Picks

EUR/USD holds above 1.1750 after mixed EU PMI data

EUR/USD manages to hold above 1.1750 but struggles to gather recovery momentum on Friday, following the mixed February PMI figures from Germany and the Eurozone. In the second half of the day, Q4 GDP, December inflation and February PMI data from the US will be watched closely by market participants.

GBP/USD recovers further toward 1.3500 after UK PMI data

GBP/USD is recovering ground further toward 1.3500 in European trading on Friday, helped by a modest uptick in the Pound Sterling after stronger-than-expected UK January Retail Sales and February PMI data. However, the pair's further upside could be limited amid persistent US Dollar strength as the focus turns to key US data. 

Gold sticks to positive bias above $5,000 ahead of US data

Gold gains some positive traction for the third consecutive day on Friday. holding above $5,000. Traders now look forward to the key US macro releases – the Advance Q4 GDP report and the Personal Consumption Expenditures (PCE) Price Index – for fresh trading impetus. 

US GDP growth expected to slow down significantly in Q4 after stellar Q3 

The United States Bureau of Economic Analysis will publish the first preliminary estimate of the fourth-quarter Gross Domestic Product at 13:30 GMT. Analysts forecast the US economy to have expanded at a 3% annualized rate, slowing down from the 4.4% growth posted in the previous quarter.

Iran tensions and AI fears at the forefront ahead of key US data

Thursday’s scorecard shows major US Stock benchmarks closed modestly in the red amid mounting US-Iran tensions and AI disruption worries. The S&P 500 shed 19 points (0.3%) to 6,861, the Nasdaq 100 lost 101 points (0.4%) to 24,797, and the Dow Jones Industrial Average dropped 267 points (0.5%) to 49,395.

Official Trump price approaches breakout with mixed signals from traders

Official Trump (TRUMP) is trading at $3.50 at the time of writing, approaching its upper consolidation range. A breakout from this range could open the door for an upside move. On-chain data shows market indecision, with balanced flows between bulls and bears, signaling a lack of clear directional bias.