|

AUD/JPY technical analysis: Choppy inside 3-day long symmetrical triangle

  • AUD/JPY keeps following a short-term symmetrical triangle formation.
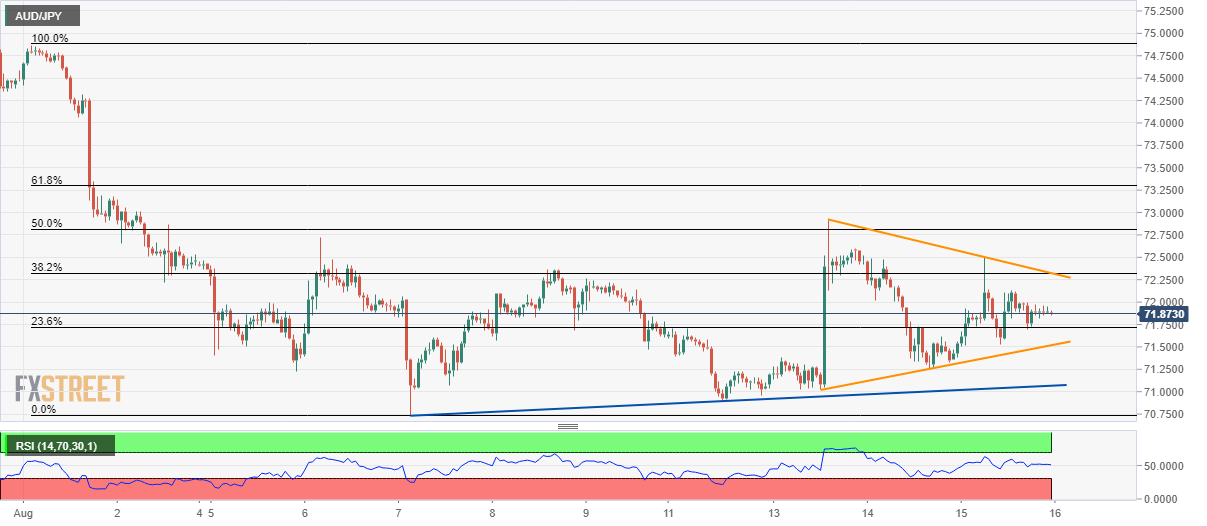
  • A one-week-old ascending trend-line adds to the support while 50% Fibonacci retracement standing on the other side.

With the three-day-old symmetrical triangle limiting the AUD/JPY pair’s short-term moves, the quote trades near 71.88 amid initial Friday morning in Asia.

The pair currently drops towards 23.6% Fibonacci retracement level of early-month south-run, at 71.72, ahead of visiting the pattern support at 71.52.

Given the pair’s slip beneath 71.52, an upward sloping trend-line since August 07, at 71.07, followed by latest low surrounding 70.70 can gain sellers’ attention.

On the upside, 38.2% Fibonacci retracement and formation resistance can keep prices in check near 72.32, a break of which can please buyers with 50% Fibonacci retracement level of 72.81.

AUD/JPY hourly chart

Trend: Sideways

    1. R3 73.63 
    2. R2 73.12 
    3. R1 72.28 
  1. PP 71.77
    1. S1  70.93
    2. S2  70.42
    3. S3  69.58

Author

Anil Panchal

Anil Panchal

FXStreet

Anil Panchal has nearly 15 years of experience in tracking financial markets. With a keen interest in macroeconomics, Anil aptly tracks global news/updates and stays well-informed about the global financial moves and their implications.

More from Anil Panchal
Share:

Editor's Picks

EUR/USD consolidates around 1.0900, bullish bias remains ahead of key US data

The EUR/USD pair is seen consolidating its strong gains registered over the past two days and oscillating in a narrow band during the Asian session on Tuesday. Spot prices currently trade around the 1.1900 mark, just below an over one-week high touched the previous day.

GBP/USD tilts bullish as markets barrel toward mid-week NFP print

GBP/USD is holding a broader bullish structure on the daily chart, with price trading well above the 50 Exponential Moving Average at 1.3507 and the 200 EMA at 1.3310, confirming the intermediate uptrend that has been in place since the November 2025 low near 1.2300. 

Gold: Will US Retail Sales data propel it above $5,100?

Gold hovers below weekly highs of $5,087 early Tuesday, await US Retail Sales data. The US Dollar enters a downside consolidation phase amid persistent Japanese Yen strength and worsening labor market. Gold settled Monday above $5,000, now looks to take out $5,100 amid bullish daily RSI.

Top Crypto Gainers: World Liberty Financial, MemeCore and Quant gain momentum

World Liberty Financial, MemeCore, and Quant are leading gains over the last 24 hours as the broader cryptocurrency market stabilizes after last week’s correction. Still, the technical outlook for altcoins remains mixed due to prevailing downside pressure and vulnerable market sentiment. 

The market is buying everything again but is it dancing on a borrowed floor

The market has a short memory and a fast trigger finger. Last week’s liquidation barely cooled before risk came roaring back, pushing the S&P toward record territory and reinstalling Big Tech as the engine of choice. This is not discovery. It is re exposure.

Ripple exposed to volatility amid low retail interest, modest fund inflows

Ripple (XRP) is extending its intraday decline to around $1.40 at the time of writing on Monday amid growing pressure from the retail market and risk-off sentiment that continues to keep investors on the sidelines.