|

AUD/JPY technical analysis: 100-HMA caps immediate upside

  • 100-HMA and RSI levels challenge post-50-HMA breakout momentum.
  • 75.00 can return on the upside break.

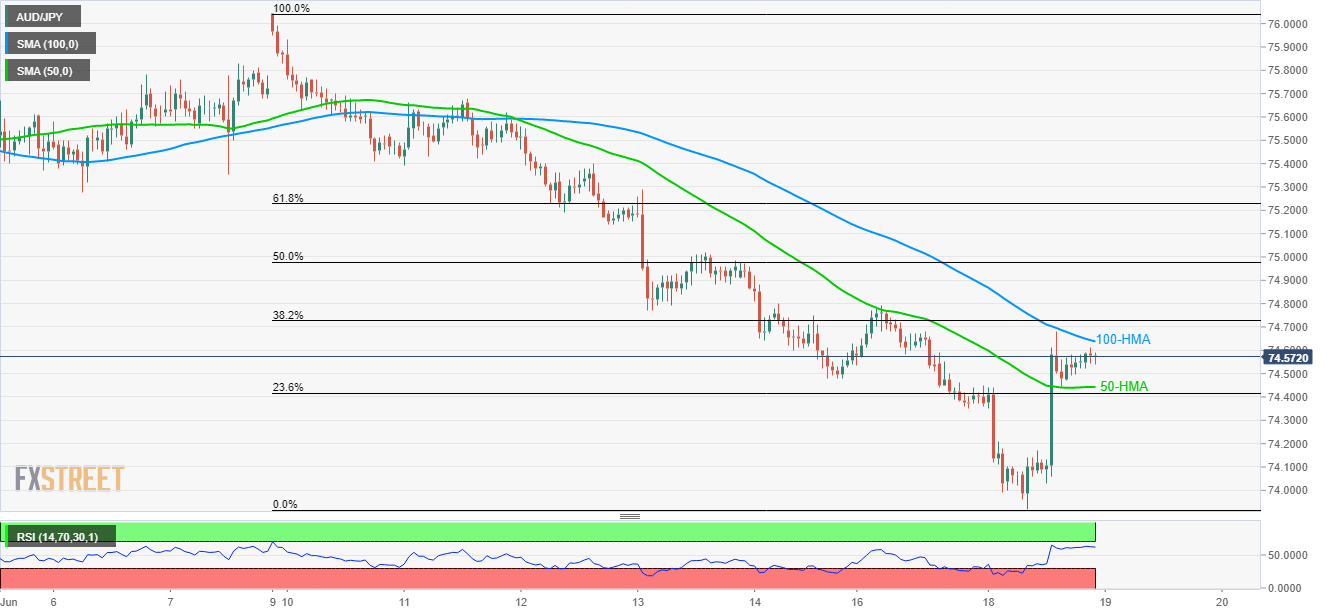
Even after clearing 50-HMA, AUD/JPY is still left to cross the 100-HMA upside barrier as it takes the rounds to 74.56 during early Tuesday.

With 14-bar relative strength index (RSI) also indicating nearly overbought conditions, pair’s failure to break the 100-hour moving average (100-HMA) can trigger its pullback to 74.44 comprising 50-HMA.

Given the quote’s extended declines beneath 74.44, 74.35 and 74.18 may offer intermediate halts before highlight latest low of 73.92 and the year 2016 low near 72.40.

Alternatively, an upside clearance of 74.64 resistance including 100-HMA may recall 75.00 back to the chart.

However, 61.8% Fibonacci retracement level of 75.23 and June 11 high surrounding 75.68 can question buyers afterward.

AUD/JPY hourly chart

Trend: Pullback expected

Additional important levels

Overview
Today last price74.58
Today Daily Change21 pips
Today Daily Change %0.28%
Today daily open74.37
 
Trends
Daily SMA2075.48
Daily SMA5077.13
Daily SMA10077.98
Daily SMA20079.14
Levels
Previous Daily High74.79
Previous Daily Low74.35
Previous Weekly High76.05
Previous Weekly Low74.48
Previous Monthly High78.72
Previous Monthly Low75.08
Daily Fibonacci 38.2%74.52
Daily Fibonacci 61.8%74.62
Daily Pivot Point S174.22
Daily Pivot Point S274.06
Daily Pivot Point S373.78
Daily Pivot Point R174.66
Daily Pivot Point R274.94
Daily Pivot Point R375.1

Author

Anil Panchal

Anil Panchal

FXStreet

Anil Panchal has nearly 15 years of experience in tracking financial markets. With a keen interest in macroeconomics, Anil aptly tracks global news/updates and stays well-informed about the global financial moves and their implications.

More from Anil Panchal
Share:

Editor's Picks

EUR/USD climbs to daily highs on US CPI

EUR/USD now accelerates it rebound and flirts with the 1.1880 zone on Friday, or daily highs, all in response to renewed selling pressure on the US Dollar. In the meantime, US inflation figures showed the headline CPI rose less than expected in January, removing some tailwinds from the Greenback’s momentum.

GBP/USD clings to gains above 1.3600

GBP/USD reverses three consecutive daily pullbacks on Friday, hovering around the low-1.3600s on the back of the vacillating performance of the Greenback in the wake of the release of US CPI prints in January. Earlier in the day, the BoE’s Pill suggested that UK inflation could settle around 2.5%, above the bank’s goal.

Gold: Upside remains capped by $5,000

Gold is reclaiming part of the ground lost on Wednesday’s marked retracement, as bargain-hunters seem to have stepped in. The precious metal’s upside, however, appears limited amid the slightly better tone in the US Dollar after US inflation data saw the CPI rise less than estimated at the beginning of the year.

Crypto Today: Bitcoin, Ethereum, XRP in choppy price action, weighed down by falling institutional interest 

Bitcoin's upside remains largely constrained amid weak technicals and declining institutional interest. Ethereum trades sideways above $1,900 support with the upside capped below $2,000 amid ETF outflows.

Week ahead – Data blitz, Fed Minutes and RBNZ decision in the spotlight

US GDP and PCE inflation are main highlights, plus the Fed minutes. UK and Japan have busy calendars too with focus on CPI. Flash PMIs for February will also be doing the rounds. RBNZ meets, is unlikely to follow RBA’s hawkish path.

Solana Price Forecast: Mixed market sentiment caps recovery

Solana (SOL) is trading at $79 as of Friday, following a correction of over 9% so far this week. On-chain and derivatives data indicates mixed sentiment among traders, further limiting the chances of a price recovery.