AUD/JPY Price Forecast: Tests nine-day support below 96.50 ahead of RBA policy decision
- AUD/JPY tests the immediate support at the nine-day EMA of 96.34.
- The 14-day RSI remains just below the 50 mark, reinforcing the prevailing bearish momentum.
- The primary barrier appears around the descending channel’s upper boundary at the 97.00 level.

AUD/JPY remains attempts to recover its recent losses registered in the previous session, hovering around 96.40 during Tuesday’s Asian hours. Traders await the Reserve Bank of Australia’s (RBA) policy decision later in the day. The central bank is widely expected to lower its Official Cash Rate (OCR) by 25 basis points (bps) to 4.10%, marking the first rate cut in four years.
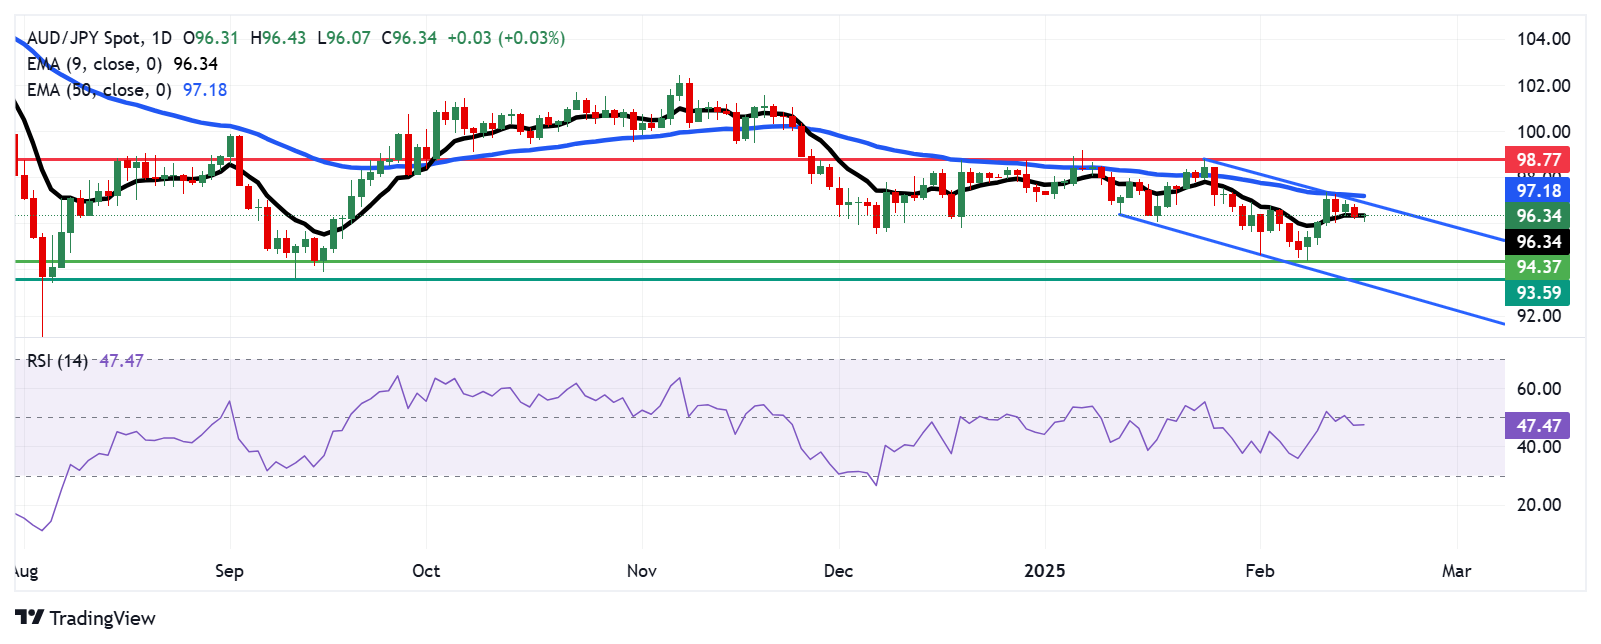
A review of the daily chart shows the currency cross trading sideways within a descending channel pattern, indicating a prevailing bearish bias. The 14-day Relative Strength Index (RSI) remains slightly below the 50 level, reinforcing bearish momentum.
However, the AUD/JPY cross continues to trade around the nine-day Exponential Moving Average (EMA), indicating that short-term price momentum is neutral. Further movement will offer a clear understanding of the directional price movement.
The immediate support level for the AUD/JPY cross is at the nine-day EMA of 96.34. A decisive break below this level could lead the currency cross to navigate the region around the five-month low of 94.37, recorded on February 10. Further support appears at the six-month low of 93.59, recorded on September 11, followed by the lower boundary of the descending channel around 93.50.
On the upside, the AUD/JPY cross could approach the upper boundary of the descending channel at the psychological level of 97.00, followed by the 50-day EMA at 97.18. A break above this critical resistance zone could cause the emergence of the bullish bias and support the currency cross to test the six-week high at 98.77 level, which was recorded on January 24.
AUD/JPY: Daily Chart
Australian Dollar PRICE Today
The table below shows the percentage change of Australian Dollar (AUD) against listed major currencies today. Australian Dollar was the strongest against the New Zealand Dollar.
| USD | EUR | GBP | JPY | CAD | AUD | NZD | CHF | |
|---|---|---|---|---|---|---|---|---|
| USD | 0.15% | 0.17% | 0.26% | 0.07% | 0.24% | 0.47% | 0.09% | |
| EUR | -0.15% | 0.02% | 0.11% | -0.08% | 0.10% | 0.32% | -0.06% | |
| GBP | -0.17% | -0.02% | 0.10% | -0.10% | 0.08% | 0.30% | -0.08% | |
| JPY | -0.26% | -0.11% | -0.10% | -0.19% | -0.02% | 0.19% | -0.18% | |
| CAD | -0.07% | 0.08% | 0.10% | 0.19% | 0.17% | 0.40% | 0.02% | |
| AUD | -0.24% | -0.10% | -0.08% | 0.02% | -0.17% | 0.22% | -0.16% | |
| NZD | -0.47% | -0.32% | -0.30% | -0.19% | -0.40% | -0.22% | -0.37% | |
| CHF | -0.09% | 0.06% | 0.08% | 0.18% | -0.02% | 0.16% | 0.37% |
The heat map shows percentage changes of major currencies against each other. The base currency is picked from the left column, while the quote currency is picked from the top row. For example, if you pick the Australian Dollar from the left column and move along the horizontal line to the US Dollar, the percentage change displayed in the box will represent AUD (base)/USD (quote).
Author

Akhtar Faruqui
FXStreet
Akhtar Faruqui is a Forex Analyst based in New Delhi, India. With a keen eye for market trends and a passion for dissecting complex financial dynamics, he is dedicated to delivering accurate and insightful Forex news and analysis.


