|

AUD/JPY Price Analysis: Struggles at 95.00, as risk-off impulse spurs a correction

  • AUD/JPY gained 0.44% on Thursday but couldn’t hold above the 95.00 level, triggering a downward correction.
  • Buyers must reclaim the Tenkan-Sen line at 95.42 to continue the upward trend, but first, they must conquer the 95.00 level.
  • If sellers maintain the price below 95.00, it could lead to a fall toward the Kijun-Sen line at 94.32.

The AUD/JPY printed solid gains of 0.44% on Thursday but failed to cling to gains past the 95.00 mark, exacerbating a downward correction amid a risk-off impulse. As Friday’s Asian session begins, the AUD/JPY is trading at 94.93, gains 0.02%, though still below the 95.00 figure, and is set to consolidate within familiar levels.

AUD/JPY Price Analysis: Technical outlook

From a daily chart perspective, the AUD/JPY is set to continue to trend upwards, but buyers must reclaim the Tenkan-Sen line at 95.42, but firstly they would need to conquer the 95.00 figure. Conversely, if AUD/JPY sellers hold prices below 95.00, that would exacerbate a fall toward the Kijun-Sen line at 94.32.

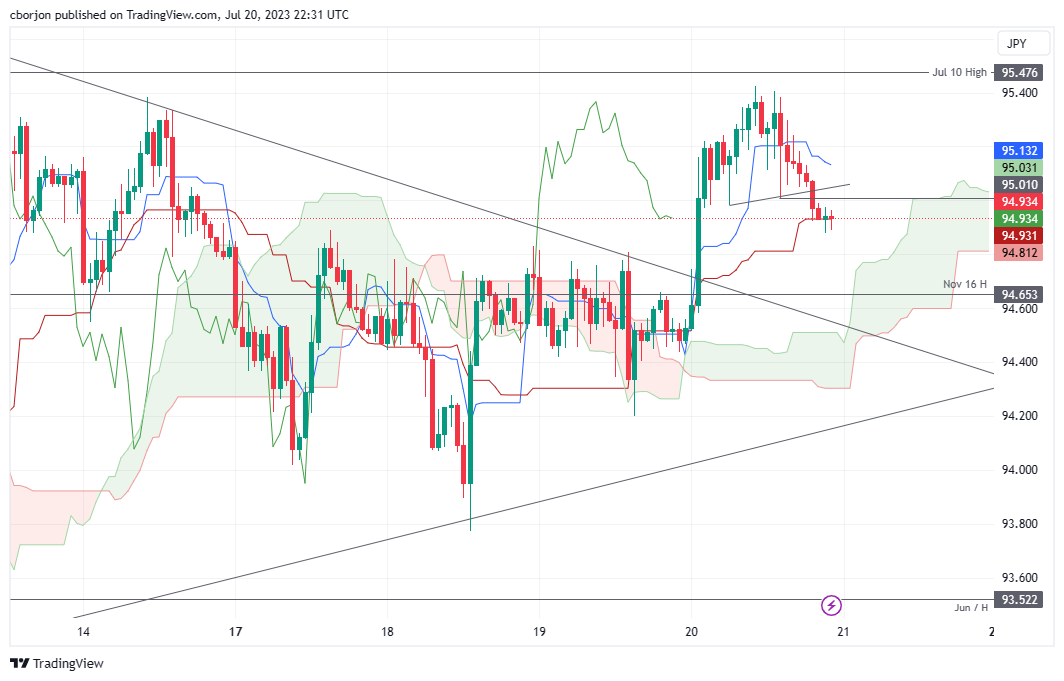
The AUD/JPY shifted neutral from an intraday perspective, as the hourly chart shows. With the price falling below the Tenkan-Sen line at 95.13 and hoovering around the Kijun-Sen line at 94.93, the pair remains trendless but slightly tilted to the downside after breaking solid support at 95.00.

If AUD/JPY dives below the Kijun-Sen level, the next stop would be the Senkou-Span B level at 94.81. Once sellers conquer that demand area, the following support would be the November 16 daily high at 94.65, followed by the top of the Ichimoku Cloud (Kumo) at 94.50.

Conversely, if AUD/JPY buyers reclaim 95.00, that could pave the way for an upside move, with the Tenkan-Sen level as the first resistance at 95.13. A breach of the latter will expose the July 10 high at 95.47, followed by the October 21 high of 95.74, before challenging 96.00.

AUD/JPY Price Action – 1-hour chart

AUD/JPY Hourly chart

AUD/JPY

Overview
Today last price94.95
Today Daily Change0.40
Today Daily Change %0.42
Today daily open94.55
 
Trends
Daily SMA2095.4
Daily SMA5093.9
Daily SMA10091.68
Daily SMA20091.89
 
Levels
Previous Daily High94.84
Previous Daily Low94.21
Previous Weekly High95.48
Previous Weekly Low93.27
Previous Monthly High97.68
Previous Monthly Low90.3
Daily Fibonacci 38.2%94.45
Daily Fibonacci 61.8%94.6
Daily Pivot Point S194.23
Daily Pivot Point S293.9
Daily Pivot Point S393.6
Daily Pivot Point R194.86
Daily Pivot Point R295.16
Daily Pivot Point R395.48

Author

Christian Borjon Valencia

Markets analyst, news editor, and trading instructor with over 14 years of experience across FX, commodities, US equity indices, and global macro markets.

More from Christian Borjon Valencia
Share:

Editor's Picks

GBP/USD slides below 1.3250 after failing to break through 23.6% Fibo

The GBP/USD pair meets with a fresh supply during the Asian session on Wednesday and moves away from a nearly two-week high around the 1.3275 region, touched the previous day. Spot prices currently trade around the 1.3235 zone, down 0.20% for the day, as traders look to speeches from Bank of England Governor Andrew Bailey and Federal Reserve Chair Kevin Warsh for a fresh impetus.

EUR/USD keeps losses near 1.1400 ahead of Eurozone inflation data

EUR/USD keeps the offered tone intact near 1.1400 in early Europe on Wednesday, pressured by receding bets for aggressive tightening by the European Central Bank (ECB). Traders will take more cues from the preliminary reading of the Eurozone's Harmonized Index of Consumer Prices and the US Manufacturing PMI report due later in the day.

Gold sticks to bearish bias below $4,000 amid Fed hike bets and Iran risks

Gold attracts fresh sellers following the previous day's good two-way price swings, and weakens further below the $4,000 psychological mark through the Asian session. This marks the third straight day of a slide and keeps the precious metal closer to its lowest level since November 2025. Moreover, a bullish US Dollar suggests that the path of least resistance for the bullion is to the downside.

Solana: Retail confidence backs SOL testing 50-day EMA breakout near $75

Solana price extends gains, testing the 50-day Exponential Moving Average around $75.00. Although institutional demand for Solana remains weak, stabilizing retail confidence, with rising funding rates and steady Open Interest, supports the mild recovery. The technical outlook for SOL shifts mildly bullish, projecting a potential breakout rally toward the $100 mark.

Kevin Warsh isn't expected to say much in Sintra: That's exactly why markets will listen

Financial markets could find an important catalyst in the enchanting, fairytale-like landscape of  Sintra this week. The European Central Bank Forum will, as it does every year, gather the crème de la crème of central banks. The new boss at the Federal Reserve, who has clearly said that the Fed should stop explaining everything, will need to talk – and traders should listen.

Kevin Warsh isn't expected to say much in Sintra: That's exactly why markets will listen

Financial markets could find an important catalyst in the enchanting, fairytale-like landscape of Sintra this week. The ECB Forum will, as it does every year, gather the crème de la crème of central banks. The new boss at the Fed, who has clearly said that the Fed should stop explaining everything, will need to talk – and traders should listen.