|

AUD/JPY Price Analysis: Strong bullish momentum pushes pair to fresh cycle highs

  • AUD/JPY continues its rally, reaching fresh cycle highs around 105.70 on Thursday.
  • Daily RSI and MACD stand deep in positive terrain.
  • Indicators point towards more room for additional gains.

During Thursday's session, the AUD/JPY pair maintained its uptrend, achieving new cycle highs around 105.70, its the highest point reached since 2013. There has been a clear consolidation around the 104.00 level in the last sessions, and as the sellers failed to make a significant move, buyers stepped in.

On a daily scale, the Relative Strength Index (RSI) of the AUDJPY has risen to 68, up from 63 recorded on Wednesday. This increase suggests bullish momentum continues to gain strength. The Moving Average Convergence Divergence (MACD) marker persists in showing rising green bars, indicating the bullish momentum is far from plateauing.

AUD/JPY daily chart

In summary, the AUD/JPY pair's robust showing on Thursday endorses a broader bullish outlook, with the intensity of the trend validated by the pair's position above the 20-day, 100-day, and 200-day Simple Moving Averages (SMAs). Looking forward, traders can expect the pair to sustain its uptrend, potentially reaching into the 105.80-106.00 range, as current indicators do not suggest over-extended movements and hence provide space for subsequent gains.

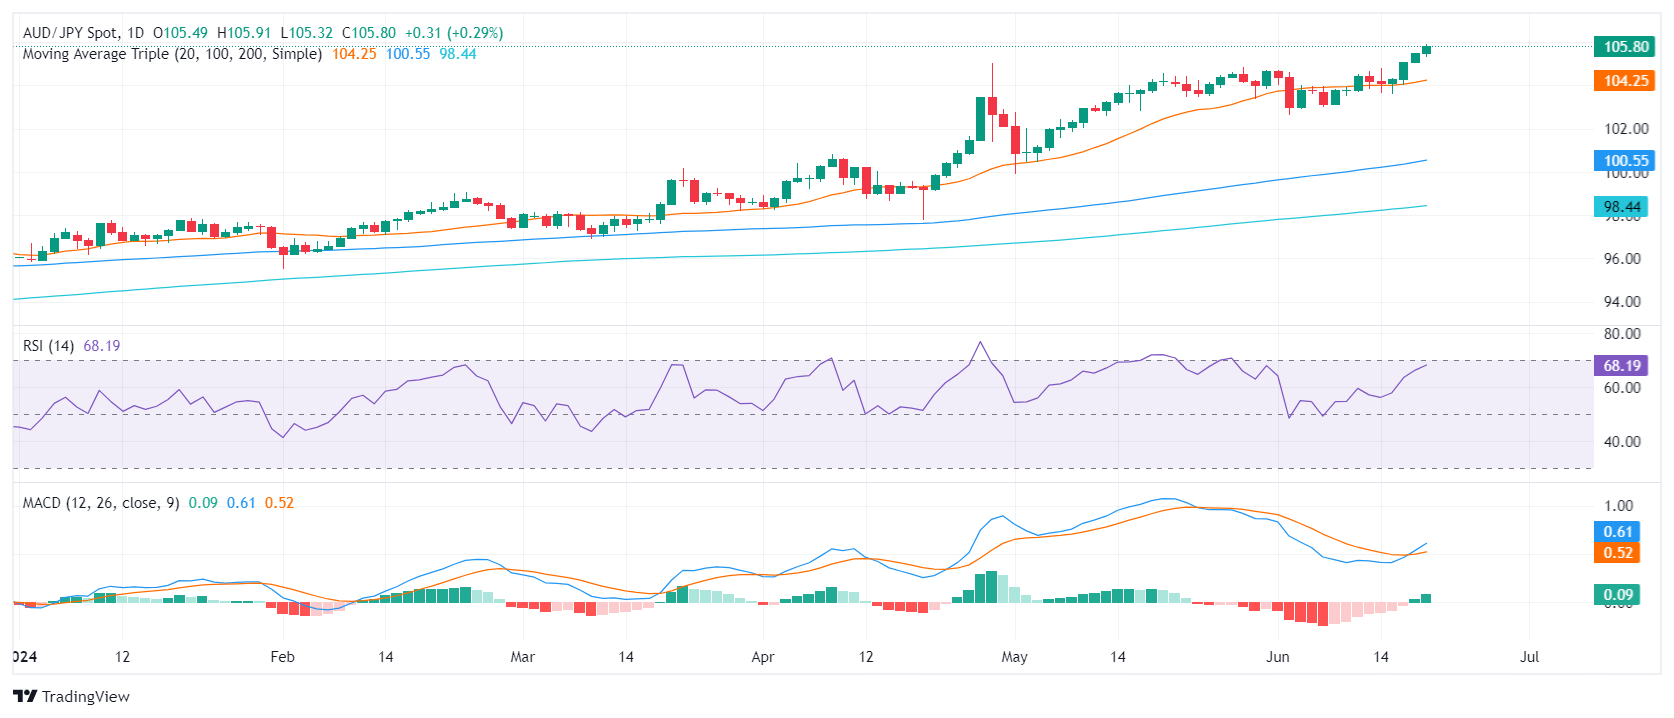
On the off chance that the pair falls below the support level set at 105.00, followed by the 104.15 level (20-day SMA), it would likely seek new support thresholds. As such, the 102.50 and 100.35 levels may serve as potential support lines.

AUD/JPY

Overview
Today last price105.78
Today Daily Change0.29
Today Daily Change %0.27
Today daily open105.49
 
Trends
Daily SMA20104.14
Daily SMA50102.7
Daily SMA100100.45
Daily SMA20098.38
 
Levels
Previous Daily High105.5
Previous Daily Low105.04
Previous Weekly High104.8
Previous Weekly Low103.08
Previous Monthly High104.87
Previous Monthly Low99.93
Daily Fibonacci 38.2%105.33
Daily Fibonacci 61.8%105.22
Daily Pivot Point S1105.19
Daily Pivot Point S2104.89
Daily Pivot Point S3104.74
Daily Pivot Point R1105.65
Daily Pivot Point R2105.8
Daily Pivot Point R3106.1

Author

Patricio Martín

Patricio is an economist from Argentina passionate about global finance and understanding the daily movements of the markets.

More from Patricio Martín
Share:

Editor's Picks

AUD/USD falls to near 0.7100 after slipping below 50-day EMA

AUD/USD depreciates after registering minor gains in the previous day, trading around 0.7120 during the Asian hours. The technical analysis of the daily chart shows the pair consolidating sideways within a rectangle pattern, as neither bulls nor bears gain control. The AUD/USD pair is holding a slight bearish tone however as it sits beneath both the nine-day and 50-day EMAs.

160.00: USD/JPY back near intervention territory after upbeat US jobs report

US Nonfarm Payrolls beat expectations by a wide margin in May, with 172K jobs added. The US Dollar rebounds after the release, helping USD/JPY recover from its intraday lows. Warnings from Japanese authorities continue to limit upside potential near the 160.00 threshold.

Gold targets $4,300 amid stronger Dollar

Gold faces increasing selling interest and navigates the area of three-month lows near the $4,300 mark per troy ounce on Friday. The precious metal’s decline comes as traders assess the stronger-than-expected NFP, while the bid bias in the Greenback and higher US Treasury yields also collaborate with the retracement.

Cardano hits five-year low even as Hoskinson clarifies "break" isn't an exit

Cardano (ADA) price is down 10% at press time on Friday, extending losses over 30% so far this week amid Charles Hoskinson's clarification that "break" isn't an exit.

Week ahead – Fed countdown begins amid US inflation data and geopolitical risks

Fed Chair Warsh’s first meeting approaches as key US inflation data could reshape expectations. Oil prices remain elevated as US-Iran talks continue; tariffs also return to the spotlight. ECB is expected to hike; will it be a one-off move or is July live?

The US economy defies the rules: 100 days into the Oil shock and the recession signal is still missing

More than three months after the start of the Iran war and the resulting disruption to global energy markets, the US economy continues to display remarkable resilience. The conflict has triggered a sharp rise in Oil prices, reignited inflationary pressures and fueled widespread concerns about a potential economic slowdown.