|

AUD/JPY Price Analysis: Hits two-week low, yet regain 104.00

  • AUD/JPY registers losses, hitting a two-week low of 103.89 before stabilizing at 104.00.
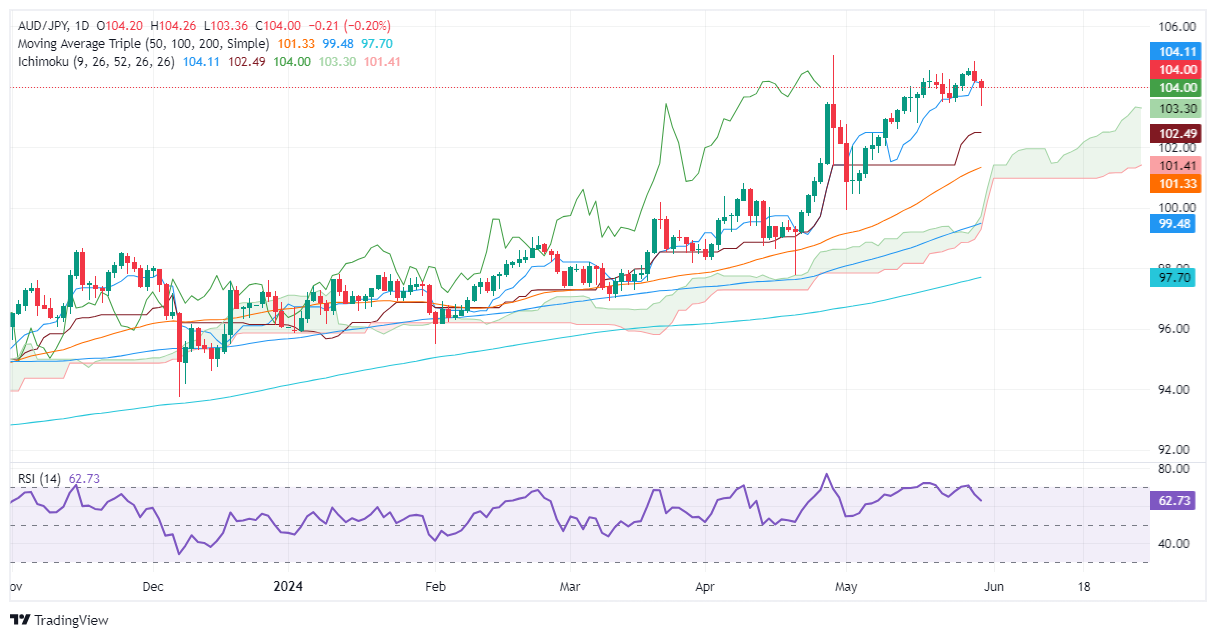
  • Technical outlook shows upward bias, but recent 'evening star' pattern indicates potential for further downside.
  • Key levels to watch: Resistance at 104.50 and 104.94 YTD high; support at 103.27 (Senkou Span A) and 102.42 (Kijun-Sen).

The Australian Dollar registered modest losses of around 0.17% against the Japanese Yen on Thursday and slipped below 104.00 to hit a two-week low of 103.89. As Friday’s Asian session begins, the AUD/JPY trades at 104.00, virtually flat.

AUD/JPY Price Analysis: Technical outlook

The pair is upward biased as shown by the daily chart, yet it remains shy of cracking the current year-to-date (YTD) high of 104.94. Three days ago, the AUD/JPY climbed sharply toward 104.84, but buyers were unable to continue to push prices higher, finishing the session in the red.

That formed a two-candle chart pattern called an ‘evening star’, pushing the exchange rate lower on Thursday, but buyers ultimately regained control.

From a momentum standpoint, the Relative Strength Index (RSI) shows that bulls are in charge.

That said, the AUD/JPY's next resistance level would be 104.50, followed by the YTD high at 104.94. Conversely, if the cross extends its losses past Thursday’s low of 103.89, that could exacerbate the pair’s downfall toward the Senkou Span A support level at 103.27 before challenging the Kijun-Sen at 102.42.

AUD/JPY Price Action – Daily Chart

AUD/JPY

Overview
Today last price104.02
Today Daily Change-0.19
Today Daily Change %-0.18
Today daily open104.21
 
Trends
Daily SMA20103.28
Daily SMA50101.24
Daily SMA10099.41
Daily SMA20097.65
 
Levels
Previous Daily High104.87
Previous Daily Low104.12
Previous Weekly High104.56
Previous Weekly Low103.48
Previous Monthly High105.04
Previous Monthly Low97.78
Daily Fibonacci 38.2%104.4
Daily Fibonacci 61.8%104.58
Daily Pivot Point S1103.93
Daily Pivot Point S2103.65
Daily Pivot Point S3103.18
Daily Pivot Point R1104.68
Daily Pivot Point R2105.15
Daily Pivot Point R3105.43

Author

Christian Borjon Valencia

Markets analyst, news editor, and trading instructor with over 14 years of experience across FX, commodities, US equity indices, and global macro markets.

More from Christian Borjon Valencia
Share:

Editor's Picks

AUD/USD falls to near 0.7100 after slipping below 50-day EMA

AUD/USD depreciates after registering minor gains in the previous day, trading around 0.7120 during the Asian hours. The technical analysis of the daily chart shows the pair consolidating sideways within a rectangle pattern, as neither bulls nor bears gain control. The AUD/USD pair is holding a slight bearish tone however as it sits beneath both the nine-day and 50-day EMAs.

160.00: USD/JPY back near intervention territory after upbeat US jobs report

US Nonfarm Payrolls beat expectations by a wide margin in May, with 172K jobs added. The US Dollar rebounds after the release, helping USD/JPY recover from its intraday lows. Warnings from Japanese authorities continue to limit upside potential near the 160.00 threshold.

Gold targets $4,300 amid stronger Dollar

Gold faces increasing selling interest and navigates the area of three-month lows near the $4,300 mark per troy ounce on Friday. The precious metal’s decline comes as traders assess the stronger-than-expected NFP, while the bid bias in the Greenback and higher US Treasury yields also collaborate with the retracement.

Cardano hits five-year low even as Hoskinson clarifies "break" isn't an exit

Cardano (ADA) price is down 10% at press time on Friday, extending losses over 30% so far this week amid Charles Hoskinson's clarification that "break" isn't an exit.

Week ahead – Fed countdown begins amid US inflation data and geopolitical risks

Fed Chair Warsh’s first meeting approaches as key US inflation data could reshape expectations. Oil prices remain elevated as US-Iran talks continue; tariffs also return to the spotlight. ECB is expected to hike; will it be a one-off move or is July live?

The US economy defies the rules: 100 days into the Oil shock and the recession signal is still missing

More than three months after the start of the Iran war and the resulting disruption to global energy markets, the US economy continues to display remarkable resilience. The conflict has triggered a sharp rise in Oil prices, reignited inflationary pressures and fueled widespread concerns about a potential economic slowdown.