AUD/JPY Price Analysis: Fades bounce off 200-SMA as bears flex muscles
- AUD/JPY remains sidelined after reversing from the key SMA earlier in the week, retreats of late.
- Clear downside break of bullish triangle, looming bear cross on the MACD.
- Bulls need validation from 93.10 for conviction, sellers may eye two-month-old support past 200-SMA break.

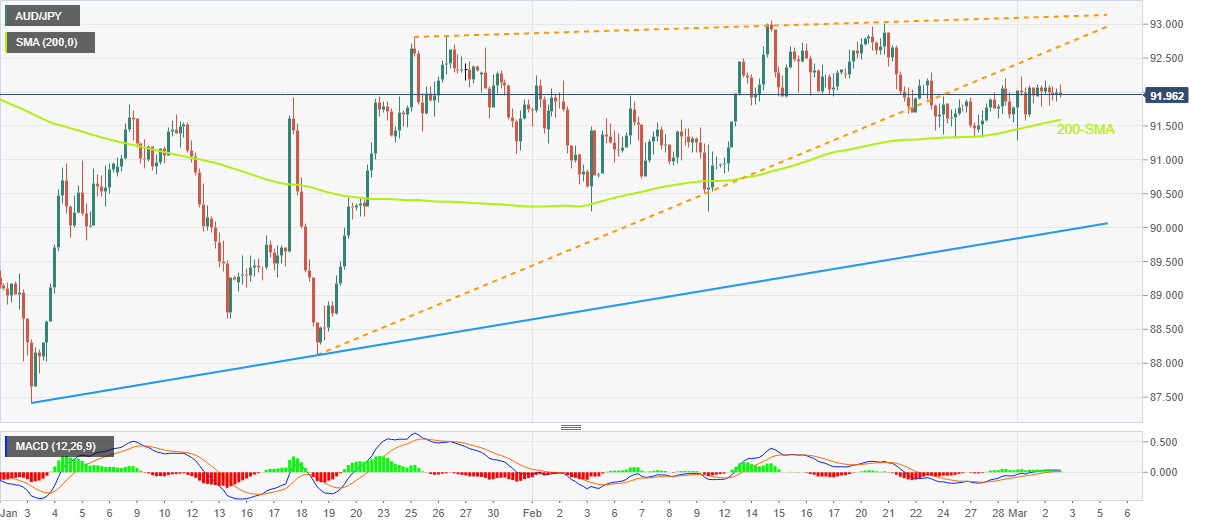
AUD/JPY bulls run out of steam around 96.00, even as the weekly performance appears mildly bid during early Friday. In doing so, the cross-currency pair signals the bear’s return, following a failure to defend the bounce off the 200-SMA, as well as amid downbeat oscillators and a clear break of the six-week-old bullish triangle.
That said, the quote drops toward the 200-bar Simple Moving Average (SMA) support near 91.60. However, the double bottoms marked during early February near 90.20-25 by the press time, could challenge the pair sellers.
Adding to the downside filter is the ascending support line from early January, close to 89.95 by the press time.
It should be observed that a successful break of the multi-day-old support line won’t hesitate to challenge the year 2023 low surrounding 87.40.
On the flip side, the lower line of the aforementioned bullish triangle, close to 92.65 at the latest, will precede the stated chart formation’s top line, around 93.10, to challenge the AUD/JPY buyers.
Should the quote remains firmer past 93.10, the mid-December 2022 swing high of 93.35 may act as the last defense of the AUD/JPY bears.
Overall, AUD/JPY remains on the bear’s radar even if the 200-SMA restricts immediate downside.
AUD/JPY: Four-hour chart
Trend: Further downside expected
Author

Anil Panchal
FXStreet
Anil Panchal has nearly 15 years of experience in tracking financial markets. With a keen interest in macroeconomics, Anil aptly tracks global news/updates and stays well-informed about the global financial moves and their implications.
















