AUD/JPY Price Analysis: Bulls ran out of steam and bears claim ground


  • The daily RSI suggests consistent buying momentum, with a slight dip indicating the possibility of a short-term correction.
  • The hourly RSI and MACD readings suggest mounting selling pressure in recent transactions.

The AUD/JPY trades at 102.43, demonstrating a pronounced bullish inclination despite Monday’s sharp losses. Indicators took a big hit and suggests that despite the bullish command, sellers are gaining ground.

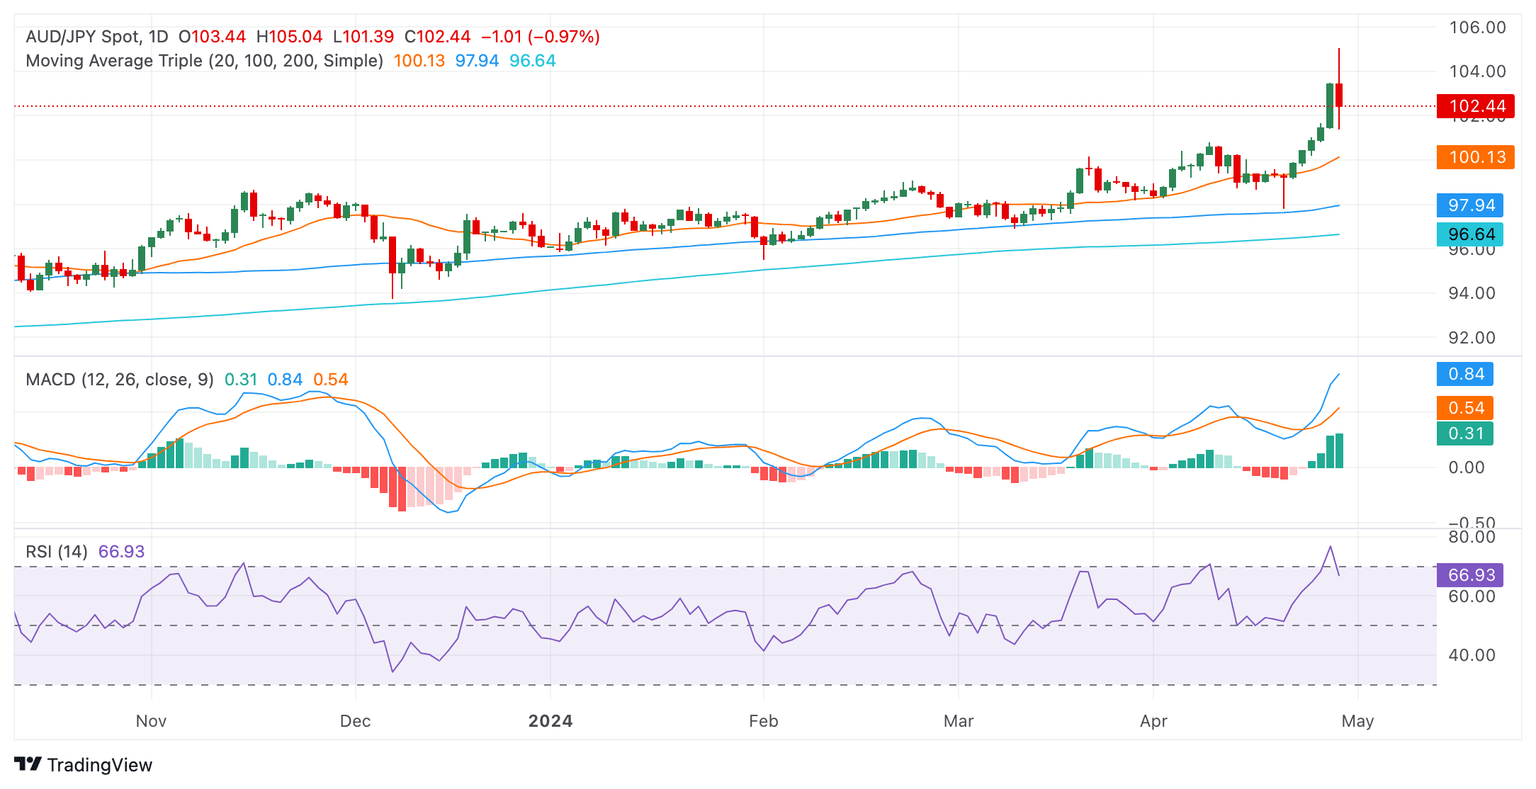
On the daily chart, the Relative Strength Index (RSI) is seen trending within the overbought terrain, suggesting that buying activity has dominated the market action. A recent dip from overbought territory to 66 indicates potential for a short-term correction in the upcoming sessions. Meanwhile, the Moving Average Convergence Divergence (MACD) maintains flat green bars, signifying stable positive momentum.

AUD/JPY daily chart
Shifting to the hourly chart, the RSI readings reveal a contrasting scenario. The hourly RSI readings are trending in the negative territory, demonstrating that selling activity had a certain control in the latest trading hours. Moreover, the hourly MACD marks flat red bars, underlining a steady negative momentum.

AUD/JPY hourly chart
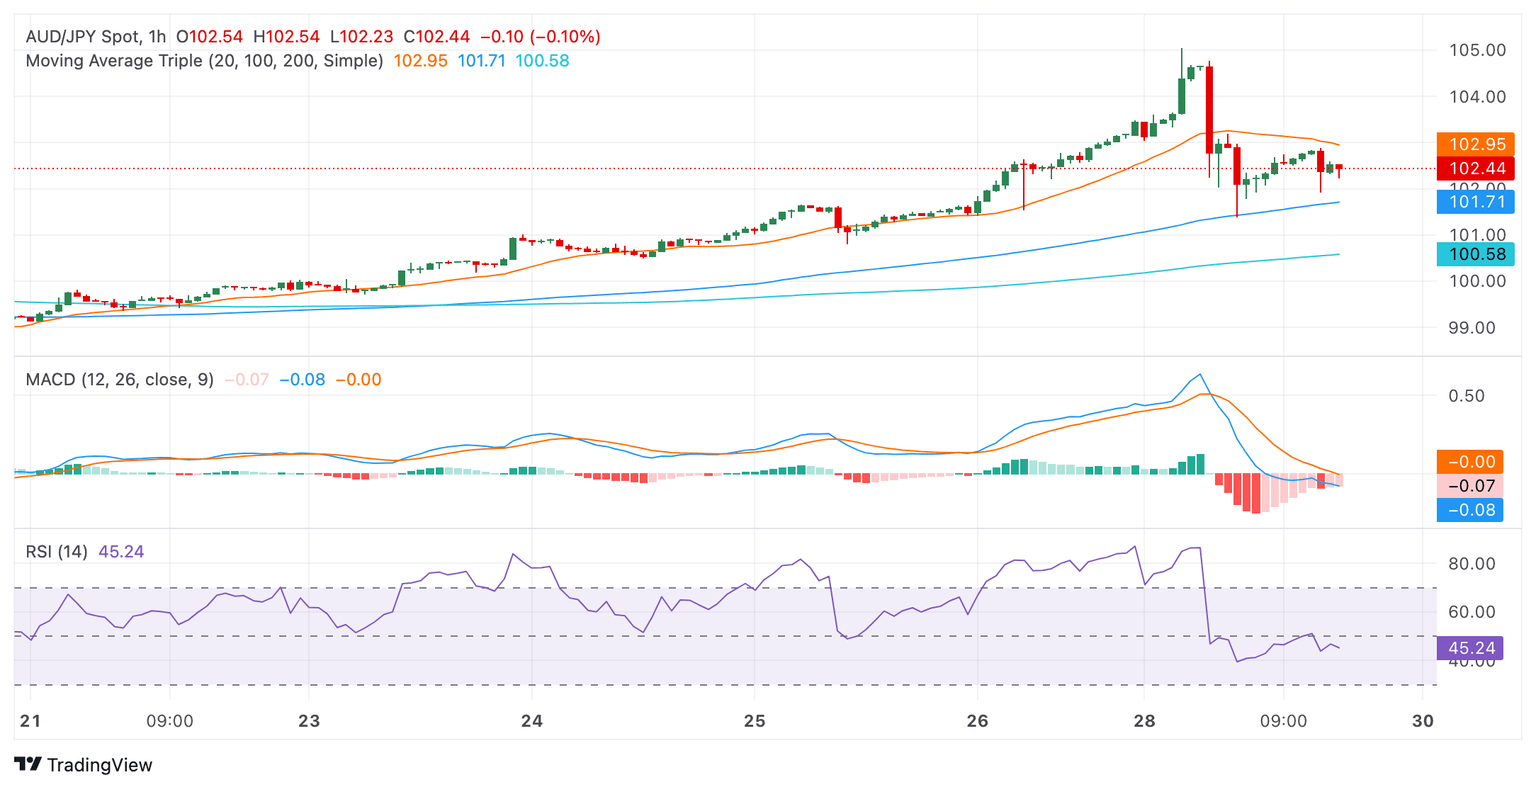
Observing the broader perspective, the AUD/JPY currently occupies a position above the 20, 100, and 200-day SMA. This stance underscores the prevailing bullish market sentiment in both short-term and long-term scenarios. In conclusion, while the daily indicators reflect an overall bullish sentiment, recent hourly readings suggest the potential for a short-term correction. Traders should monitor these contrasting signals closely as there might be a shift in the momentum in favor of the sellers and they might reclaim the 20-day SMA.


AUD/JPY

Overview
Today last price 102.5
Today Daily Change -0.94
Today Daily Change % -0.91
Today daily open 103.44
 
Trends
Daily SMA20 99.93
Daily SMA50 98.93
Daily SMA100 97.88
Daily SMA200 96.61
 
Levels
Previous Daily High 103.48
Previous Daily Low 101.41
Previous Weekly High 103.48
Previous Weekly Low 99.13
Previous Monthly High 100.17
Previous Monthly Low 96.9
Daily Fibonacci 38.2% 102.69
Daily Fibonacci 61.8% 102.2
Daily Pivot Point S1 102.07
Daily Pivot Point S2 100.7
Daily Pivot Point S3 100
Daily Pivot Point R1 104.15
Daily Pivot Point R2 104.85
Daily Pivot Point R3 106.22


Share: Feed news

Information on these pages contains forward-looking statements that involve risks and uncertainties. Markets and instruments profiled on this page are for informational purposes only and should not in any way come across as a recommendation to buy or sell in these assets. You should do your own thorough research before making any investment decisions. FXStreet does not in any way guarantee that this information is free from mistakes, errors, or material misstatements. It also does not guarantee that this information is of a timely nature. Investing in Open Markets involves a great deal of risk, including the loss of all or a portion of your investment, as well as emotional distress. All risks, losses and costs associated with investing, including total loss of principal, are your responsibility. The views and opinions expressed in this article are those of the authors and do not necessarily reflect the official policy or position of FXStreet nor its advertisers. The author will not be held responsible for information that is found at the end of links posted on this page.

If not otherwise explicitly mentioned in the body of the article, at the time of writing, the author has no position in any stock mentioned in this article and no business relationship with any company mentioned. The author has not received compensation for writing this article, other than from FXStreet.

FXStreet and the author do not provide personalized recommendations. The author makes no representations as to the accuracy, completeness, or suitability of this information. FXStreet and the author will not be liable for any errors, omissions or any losses, injuries or damages arising from this information and its display or use. Errors and omissions excepted.

The author and FXStreet are not registered investment advisors and nothing in this article is intended to be investment advice.

Recommended content


Recommended content

Editors’ Picks

AUD/USD retreats from four-month highs after higher Unemployment Rate

AUD/USD retreats from four-month highs after higher Unemployment Rate

The AUD/USD snapped its three-day winning streak, trading around 0.6680 after the higher-than-expected Aussie Unemployment Rate on Thursday, which rose to 4.1% in April from the previous reading of 3.9%. 

AUD/USD News

USD/JPY trims losses below 154.50 following Japan’s GDP data

USD/JPY trims losses below 154.50 following Japan’s GDP data

USD/JPY trims losses near 154.45 during the Asian session on Thursday. The softer US CPI inflation data has exerted some selling pressure on the US Dollar. However, the major pair recovers modestly following the recent weaker-than-expected Japan’s GDP in the first quarter of 2024. 

USD/JPY News

Gold price jumps as US CPI inflation fuels Fed rate cuts

Gold price jumps as US CPI inflation fuels Fed rate cuts

Gold price gains traction amid the weaker US Dollar on Thursday. The recent Consumer Price Index report showed inflation in the US slowed in April, prompting market players to increase their bets on the US Federal Reserve rate cuts this year. 

Gold News

DOGE’s 15% upside potential hinges on Bitcoin holding above $65K

DOGE’s 15% upside potential hinges on Bitcoin holding above $65K

Dogecoin price is trading with a bullish bias, leading meme coins north as sector bulls resurface. This show of hand comes after Bitcoin price broke past the $65,000 threshold and could extend if the pioneer cryptocurrency holds above this level.

Read more

Dow Jones Industrial Average soars 350 points, sets new all-time high as rate cut hopes surge

Dow Jones Industrial Average soars 350 points, sets new all-time high as rate cut hopes surge

The Dow Jones Industrial Average clipped into a fresh all-time high on Wednesday, gaining almost nine-tenths of a percent during the US market session after US Consumer Price Index inflation slipped further back.

Read more

Forex MAJORS

Cryptocurrencies

Signatures