|

AUD/JPY Price Analysis: Bears push lower as key support approaches

  • AUD/JPY was seen trading around the 94.50 zone ahead of the Asian session, marking its second consecutive decline.
  • The 20-day SMA near 94.00 is coming into focus, with a break below signaling a potential shift in sentiment.
  • Traders should monitor the RSI as it approaches the 50 mark, as a drop below could reinforce bearish momentum.

AUD/JPY extended its decline on Wednesday ahead of the Asian session, slipping toward the 94.50 area after a second consecutive day in the red. The retreat comes after the pair struggled to maintain momentum above recent highs, suggesting a cooling of bullish sentiment.

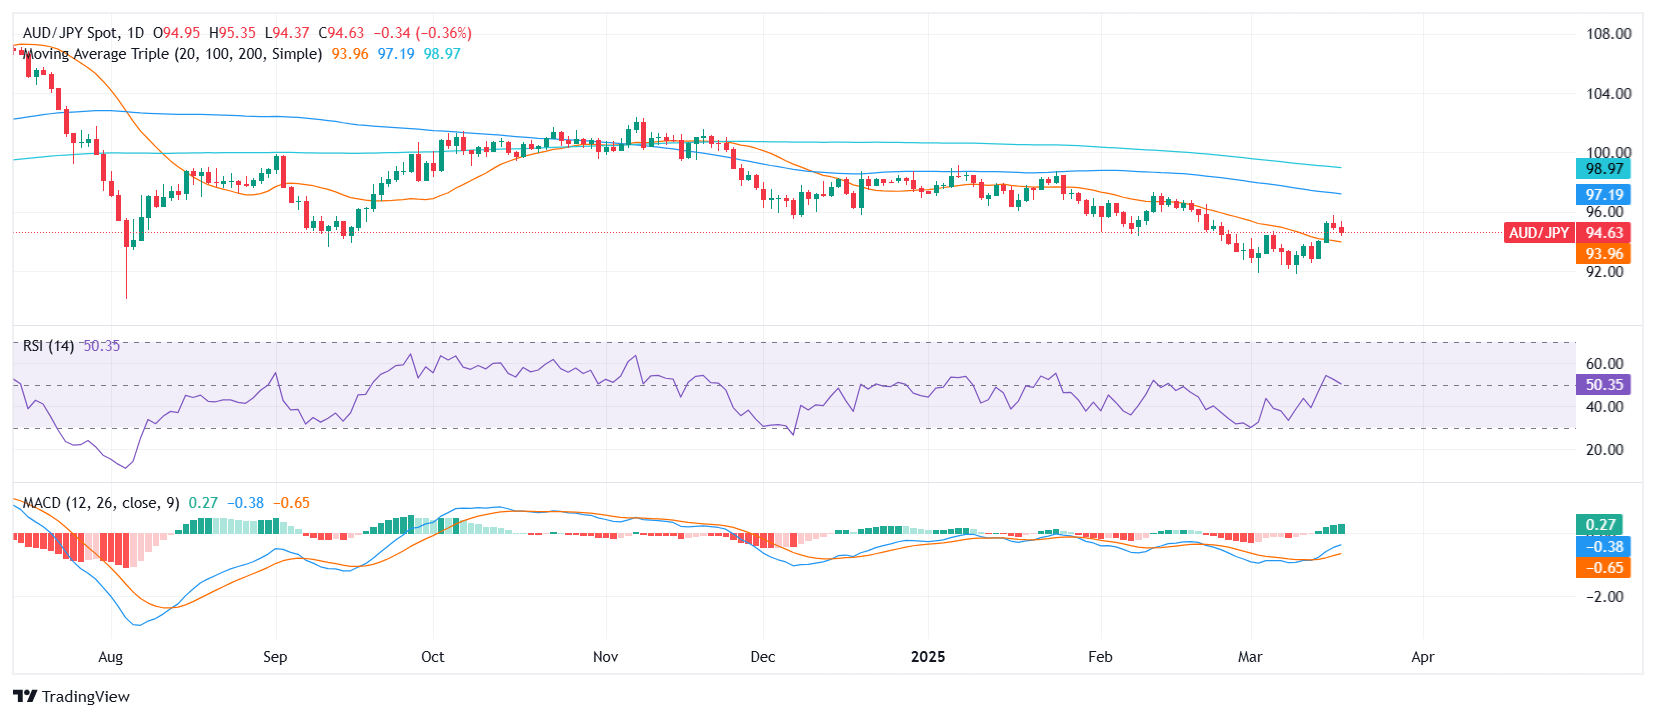
The Relative Strength Index (RSI) is declining, now hovering near the neutral 50 mark. A move below this threshold could indicate growing bearish pressure. Meanwhile, the Moving Average Convergence Divergence (MACD) is printing flat green bars, signaling waning upside momentum.

The immediate support level is located at the 20-day Simple Moving Average (SMA) near 94.00, a key level that, if breached, could open the door for further declines. Below that, additional support lies at 93.50. On the upside, resistance is seen at 95.00, followed by a more significant barrier near 96.00.

AUD/JPY daily chart

Author

Patricio Martín

Patricio is an economist from Argentina passionate about global finance and understanding the daily movements of the markets.

More from Patricio Martín
Share:

Markets move fast. We move first.

Orange Juice Newsletter brings you expert driven insights - not headlines. Every day on your inbox.

By subscribing you agree to our Terms and conditions.

Editor's Picks

EUR/USD: Bulls pray for a dovish Fed

EUR/USD has finally taken a breather after a pretty energetic climb. The pair broke above 1.1680 in the second half of the week, reaching its highest levels in around two months before running into some selling pressure. Even so, it has gained almost two cents from the late-November dip just below 1.1500 the figure.

GBP/USD trims gains, recedes toward 1.3320

GBP/USD is struggling to keep its daily advance, coming under fresh pressure and retreating to the 1.3320 zone following a mild bullish attempt in the Greenback. Even though US consumer sentiment surprised to the upside, the US Dollar isn’t getting much love, as traders are far more interested in what the Fed will say next week.

Gold: Bullish momentum fades despite broad USD weakness

After rising more than 3.5% in the previous week, Gold has entered a consolidation phase and fluctuated at around $4,200. The Federal Reserve’s interest rate decision and revised Summary of Economic Projections, also known as the dot plot, could trigger the next directional move in XAU/USD. 

Week ahead: Rate cut or market shock? The Fed decides

Fed rate cut widely expected; dot plot and overall meeting rhetoric also matter. Risk appetite is supported by Fed rate cut expectations; cryptos show signs of life. RBA, BoC and SNB also meet; chances of surprises are relatively low. Dollar weakness could linger; both the aussie and the yen best positioned to gain further. Gold and oil eye Ukraine-Russia developments; a peace deal remains elusive.

The Silver disconnection is real

Silver just hit a new all-time high. Neither did gold, nor mining stocks. They all reversed on an intraday basis, but silver’s move to new highs makes it still bullish overall, while the almost complete reversals in gold and miners make the latter technically bearish.

Ripple faces persistent bear risks, shrugging off ETF inflows

Ripple is extending its decline for the second consecutive day, trading at $2.06 at the time of writing on Friday. Sentiment surrounding the cross-border remittance token continues to lag despite steady inflows into XRP spot ETFs.