AUD/JPY Price Analysis: 200-HMA regains bull’s attention on upbeat Aussie employment data


  • AUD/JPY pokes two-day-old descending resistance line on strong Australia jobs report for December.
  • Aussie Employment Change rose past forecast, Unemployment Rate dropped.
  • Firmer RSI, upbeat data keeps buyers hopeful but two-week-long descending trend line is the key hurdle.

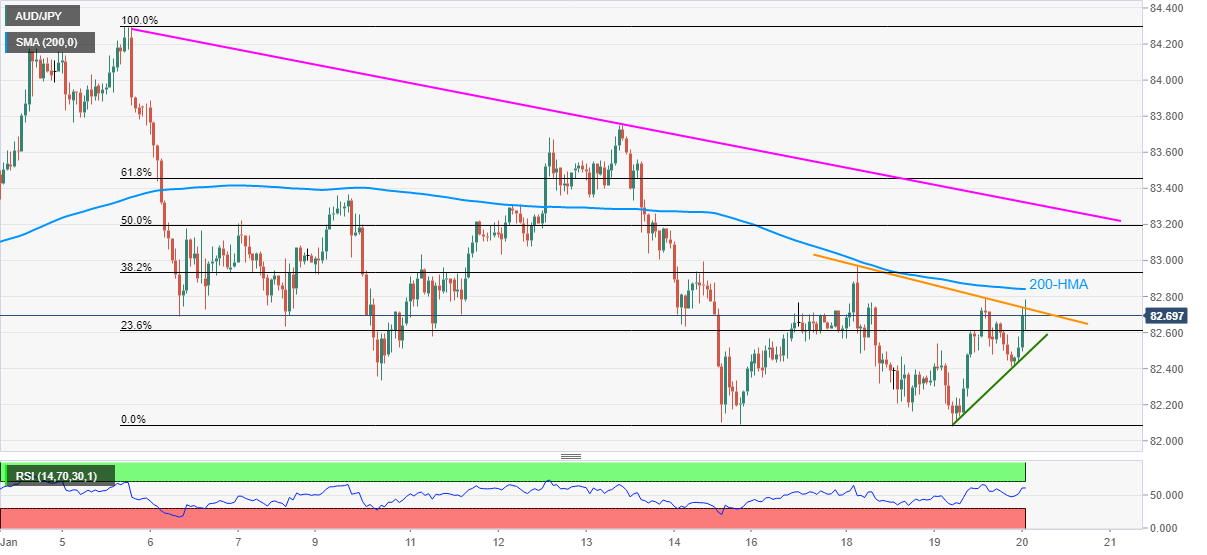
AUD/JPY cheered upbeat Australia jobs report while poking an immediate resistance line near 82.70, up 0.27% intraday during early Thursday.

Australia’s headline Employment Change rose past 30.0K forecast to 64.8K while the Unemployment Rate dropped below 4.5% market consensus and 4.6% prior t o4.2%. Further, Fulltime Employment eased below 128.3K previous readouts to 41.5K and the Participation Rate also reprinted 66.1% figure versus 66.2% market forecasts.

Read: Breaking: Australia Employment Report: Upbeat details for December recall AUD/USD buyers

That said, firmer RSI conditions, not overbought, also favor the AUD/JPY bulls to overcome the immediate trend line hurdle surrounding 82.75.

However, the 200-HMA level 82.85 and a descending trend line from January 05, close to 83.30, will challenge the pair buyers afterward.

On the contrary, an upward sloping trend line from the previous day, near 82.45, restricts the quote’s immediate downside ahead of the monthly low of 82.08 and the 82.00 threshold.

Following that, a gradual decline towards the early December swing high near 81.70 can’t be ruled out.

AUD/JPY: Hourly chart

Trend: Further recovery expected

Additional important levels

Overview
Today last price 82.7
Today Daily Change 0.22
Today Daily Change % 0.27%
Today daily open 82.48
 
Trends
Daily SMA20 83.07
Daily SMA50 82.27
Daily SMA100 82.4
Daily SMA200 82.62
 
Levels
Previous Daily High 82.8
Previous Daily Low 82.08
Previous Weekly High 83.75
Previous Weekly Low 82.09
Previous Monthly High 83.76
Previous Monthly Low 78.79
Daily Fibonacci 38.2% 82.52
Daily Fibonacci 61.8% 82.36
Daily Pivot Point S1 82.11
Daily Pivot Point S2 81.74
Daily Pivot Point S3 81.39
Daily Pivot Point R1 82.82
Daily Pivot Point R2 83.17
Daily Pivot Point R3 83.54


Share: Feed news

Information on these pages contains forward-looking statements that involve risks and uncertainties. Markets and instruments profiled on this page are for informational purposes only and should not in any way come across as a recommendation to buy or sell in these assets. You should do your own thorough research before making any investment decisions. FXStreet does not in any way guarantee that this information is free from mistakes, errors, or material misstatements. It also does not guarantee that this information is of a timely nature. Investing in Open Markets involves a great deal of risk, including the loss of all or a portion of your investment, as well as emotional distress. All risks, losses and costs associated with investing, including total loss of principal, are your responsibility. The views and opinions expressed in this article are those of the authors and do not necessarily reflect the official policy or position of FXStreet nor its advertisers. The author will not be held responsible for information that is found at the end of links posted on this page.

If not otherwise explicitly mentioned in the body of the article, at the time of writing, the author has no position in any stock mentioned in this article and no business relationship with any company mentioned. The author has not received compensation for writing this article, other than from FXStreet.

FXStreet and the author do not provide personalized recommendations. The author makes no representations as to the accuracy, completeness, or suitability of this information. FXStreet and the author will not be liable for any errors, omissions or any losses, injuries or damages arising from this information and its display or use. Errors and omissions excepted.

The author and FXStreet are not registered investment advisors and nothing in this article is intended to be investment advice.

Recommended content


Recommended content

Editors’ Picks

EUR/USD edges lower toward 1.0700 post-US PCE

EUR/USD edges lower toward 1.0700 post-US PCE

EUR/USD stays under modest bearish pressure but manages to hold above 1.0700 in the American session on Friday. The US Dollar (USD) gathers strength against its rivals after the stronger-than-forecast PCE inflation data, not allowing the pair to gain traction.

EUR/USD News

GBP/USD retreats to 1.2500 on renewed USD strength

GBP/USD retreats to 1.2500 on renewed USD strength

GBP/USD lost its traction and turned negative on the day near 1.2500. Following the stronger-than-expected PCE inflation readings from the US, the USD stays resilient and makes it difficult for the pair to gather recovery momentum.

GBP/USD News

Gold struggles to hold above $2,350 following US inflation

Gold struggles to hold above $2,350 following US inflation

Gold turned south and declined toward $2,340, erasing a large portion of its daily gains, as the USD benefited from PCE inflation data. The benchmark 10-year US yield, however, stays in negative territory and helps XAU/USD limit its losses. 

Gold News

Bitcoin Weekly Forecast: BTC’s next breakout could propel it to $80,000 Premium

Bitcoin Weekly Forecast: BTC’s next breakout could propel it to $80,000

Bitcoin’s recent price consolidation could be nearing its end as technical indicators and on-chain metrics suggest a potential upward breakout. However, this move would not be straightforward and could punish impatient investors. 

Read more

Week ahead – Hawkish risk as Fed and NFP on tap, Eurozone data eyed too

Week ahead – Hawkish risk as Fed and NFP on tap, Eurozone data eyed too

Fed meets on Wednesday as US inflation stays elevated. Will Friday’s jobs report bring relief or more angst for the markets? Eurozone flash GDP and CPI numbers in focus for the Euro.

Read more

Forex MAJORS

Cryptocurrencies

Signatures