Asian Paints Elliott Wave technical analysis [Video]
![Asian Paints Elliott Wave technical analysis [Video]](https://editorial.fxstreet.com/images/i/bearish-line_XtraLarge.png)
Asian Paints Elliott Wave technical analysis
Function: Counter Trend Lower (Minor Degree Grey).
Mode: Corrective.
Structure: Flat (3-3-5).
Position: Minor Wave C.
Details: A Minor degree corrective wave A-B-C is unfolding against 3410 with A and B in place already. High probable count suggests Minute Wave C is now complete or near to completion. Minute Wave ((v)) within C could be unfolding towards 2000-2200 levels now. A push through 2370 invalidates.
Invalidation point: 2370.
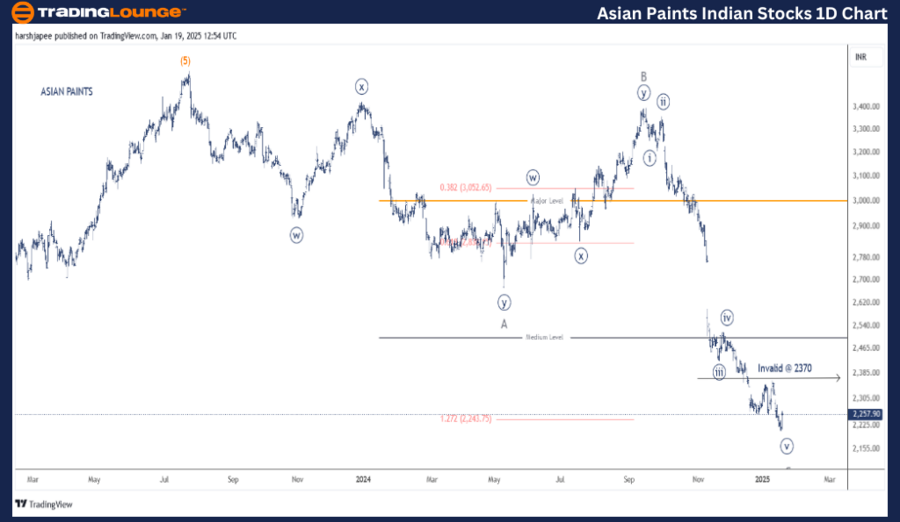
Asian Paints index daily chart technical analysis and potential Elliott Wave counts:
Asian Paints daily chart is indicating a corrective wave nearly complete at Minor degree (A-B-C) after the stock turned lower from 3270 high in July 2023. The stock is seen to be bouncing off 2200 lows and need to break above 2370 to confirm.
If the slide continues from here, the stock could find support around 2000 levels going forward. Earlier, Minor Wave A and B sub divided as combinations, terminating around 2675 and 3390 levels respectively. Further, Wave C has unfolded as an impulse with third wave being extended.
Asian Paints Elliott Wave technical analysis
Function: Counter Trend Lower (Minor Degree Grey).
Mode: Corrective.
Structure: Flat (3-3-5).
Position: Minor Wave C.
Details: A Minor degree corrective wave A-B-C is unfolding against 3410 with A and B in place already. High probable count suggests Minute Wave C is now complete or near to completion. Minute Wave ((v)) within C could be unfolding towards 2000-2200 levels now. A push through 2370 invalidates.
Invalidation point: 2370.
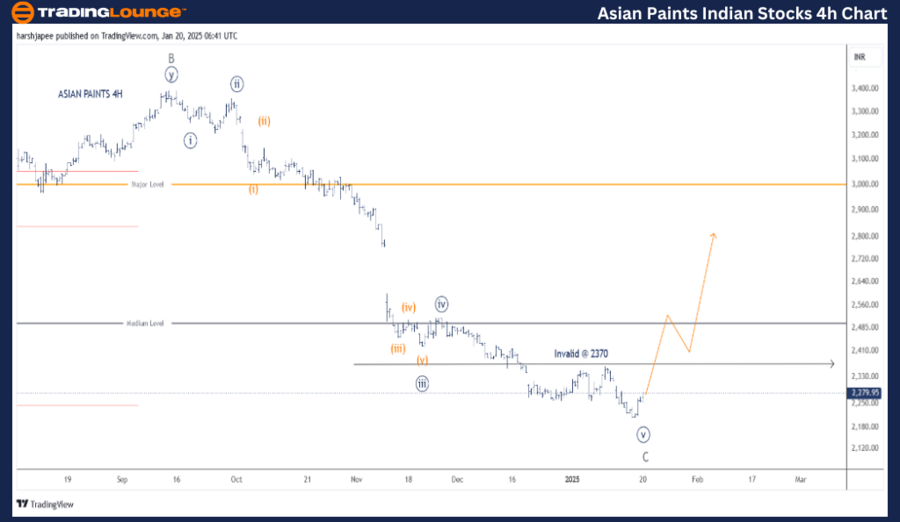
Asian Paints four-hour chart technical analysis and potential Elliott Wave counts:
Asian Paints 4H chart is highlighting the recent drop from 3390 high, Minor Wave B termination. The sub waves at Minute degree are looking complete around the 2200 range. Also note that Minute Wave ((iii)) was extended with Minute waves labelled.
A push above 2370 mark, which is Wave (iv) termination and immediate resistance, would confirm a bottom in place and that bulls are back in control in the medium term.
Conclusion
Asian Paint might have completed Minute Wave ((v)) of Minor Wave C around the 2200 mark today. If correct, bulls could take out 2370 soon.
Asian Paints Elliott Wave technical analysis [Video]
Author

Peter Mathers
TradingLounge
Peter Mathers started actively trading in 1982. He began his career at Hoei and Shoin, a Japanese futures trading company.


