Apple Stock Price and Forecast: Three reasons why AAPL stock is set to fall
- Apple again barely moves on Tuesday as it flatlines.
- AAPL stock is poised near all-time highs.
- Apple stock awaiting CPI later on Wednesday.
Apple stock again barely registered a move on Tuesday as the overall market continues to trade very cautiously ahead of Wednesday's US CPI data. Inflation has been off the agenda for a while now as the Fed hammered home the message that it was "transitory" and the market eventually took the message. This set the stage for equities to stage a neat summer rally with the underperforming Nasdaq taking on the leadership role and pushing to new highs. The other indices just followed suit. Apple stock was not to be outdone, rousing itself from the low $120s to push on through to record highs and in the process nearly crack $150.
-637642689790958188.png)
Apple released results at the end of July, and they once again were comfortably ahead of expectations. Back in late April Apple beat estimates by 40%. This time in late July, earnings per share (EPS) beat by 30% and revenue was also well ahead of forecasts. However, the stock has yet to see solid follow-through. Apple stock pushed to a record high on the announcement but was soon trading lower and has remained in the mid $140s since. This may be a consolidation phase before a new phase of the bullish trend or it may be a more worrying double top formation at $150, with two tops from July 15 and 27.
Apple key statistics
| Market Cap | $2.4 trillion |
| Enterprise Value | $2.3 trillion |
| Price/Earnings (P/E) | 29 |
|
Price/Book | 38 |
| Price/Sales | 9 |
| Gross Margin | 41% |
| Net Margin | 25% |
| EBITDA | $112 billion |
| 52 week low | $89.14 |
| 52 week high | $150 |
| Average Wall Street rating and price target |
Buy $165 |
Apple stock forecast
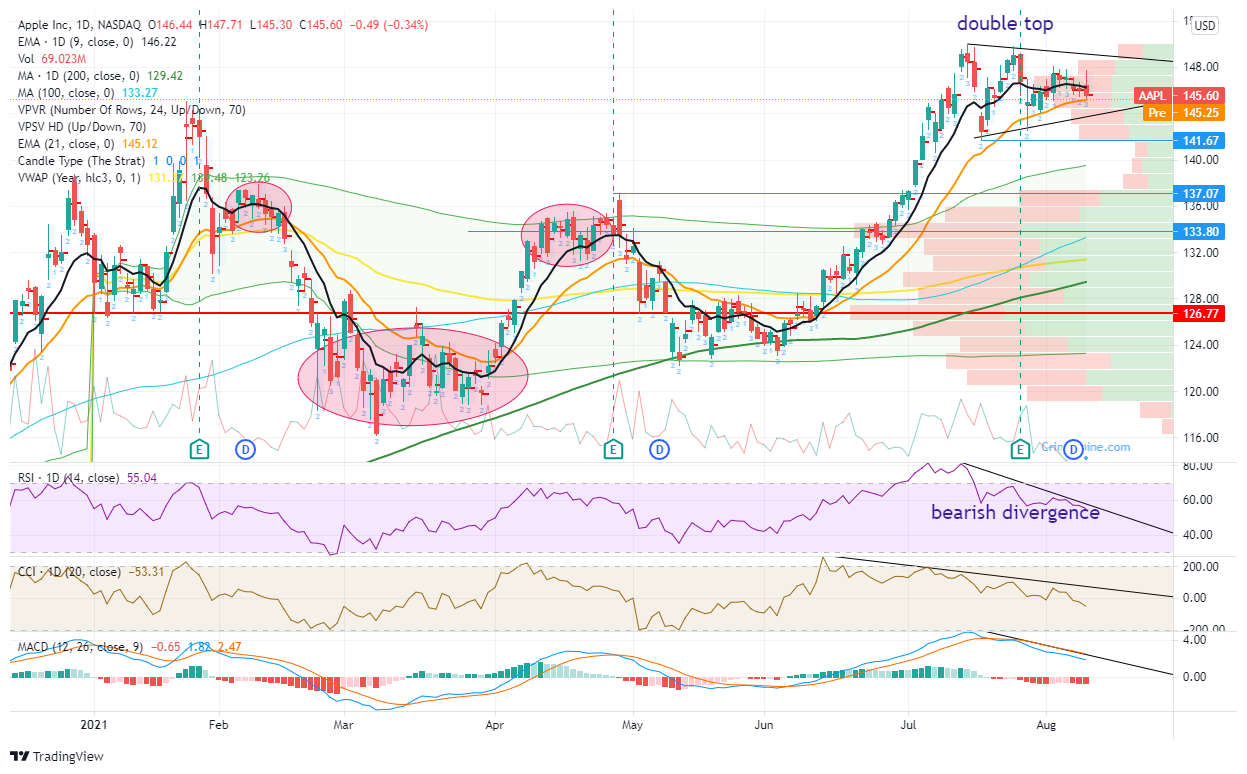
The chart below identifies clearly the double top formation in place with two peaks at $150. A double top is a bearish formation but in this case, it has yet to trigger. A double top formation is not confirmed until the stock breaks below the first retracement from the initial top. In the case of Apple, this is at $141.67. We have drawn a horizontal line to make this more clear on the chart. Breaking $141.67 confirms the double top and is then a strong bearish signal. Adding to the bearish technical overview are the bearish divergences seen from the main momentum oscillators. The Relative Strength Index (RSI), Commodity Channel Index (CCI), and Moving Average Convergence Divergence (MACD) are all trending lower from the first peak at $150 and did not match the second peak or double top. Apple was also cautious on the post earnings conference call about outlook and guidance.
Our strategy then is to wait for a confirmation of the double top. A break of $141.67 should accelerate due to the lack of volume as we can see from the volume profile bars on the right of the chart. Support does not pick up again until the low $130's. $133.80 should be the short term target of a break of $141.67. Buying a put option should see benefits from the directional move and from the expected increase in volatility a=due to the lack of volume under $141.47.
Failure to break the $141.67 level should see Apple stock look to break the small wedge formation in place before testing again all time highs at $150. But this move is more likely to be slow and steady without much acceleration.
Like this article? Help us with some feedback by answering this survey:
Premium
You have reached your limit of 3 free articles for this month.
Start your subscription and get access to all our original articles.
Author

Ivan Brian
FXStreet
Ivan Brian started his career with AIB Bank in corporate finance and then worked for seven years at Baxter. He started as a macro analyst before becoming Head of Research and then CFO.


