Analog Devices Inc.(ADI) Elliott Wave technical analysis [Video]
![Analog Devices Inc.(ADI) Elliott Wave technical analysis [Video]](https://editorial.fxstreet.com/images/TechnicalAnalysis/ChartPatterns/PointFigure/stock-market-performance-9668321_XtraLarge.jpg)
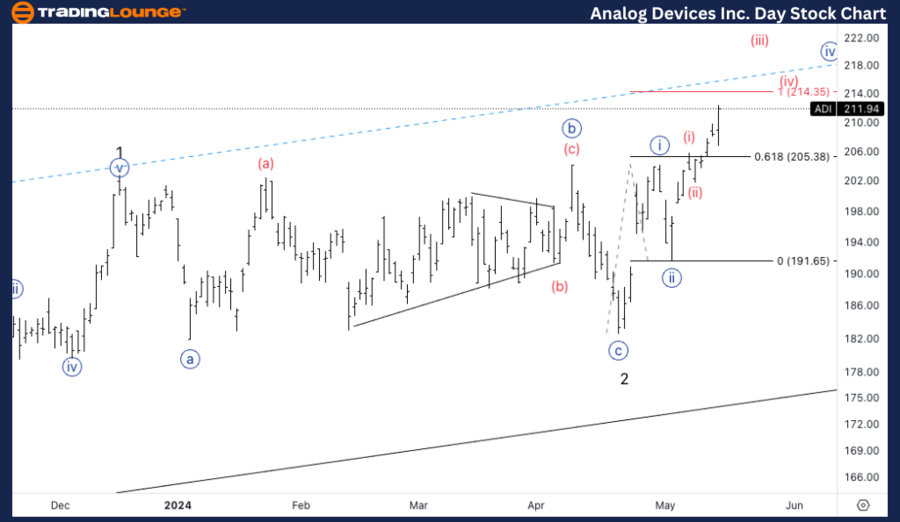
Analog Devices Inc., (ADI) daily chart
ADI Elliott Wave technical analysis
Function: Trend.
Mode: Impulsive.
Structure: Motive.
Position: Minute wave {iii}.
Direction: Upside in Minute {iii}.
Details: Looking for Medium Level at 250$ to be the next strong resistance as we are trading within MG1.
ADI Elliott Wave technical analysis – Daily chart
The daily chart for ADI reveals that the stock is in Minute wave {iii}, part of an impulsive move. The next significant level to watch is the Medium Level at $250, which is expected to provide strong resistance. As ADI trades within MG1, this level becomes a critical point for potential price action. Traders should be aware of this resistance zone and monitor the price behavior closely as it approaches $250.
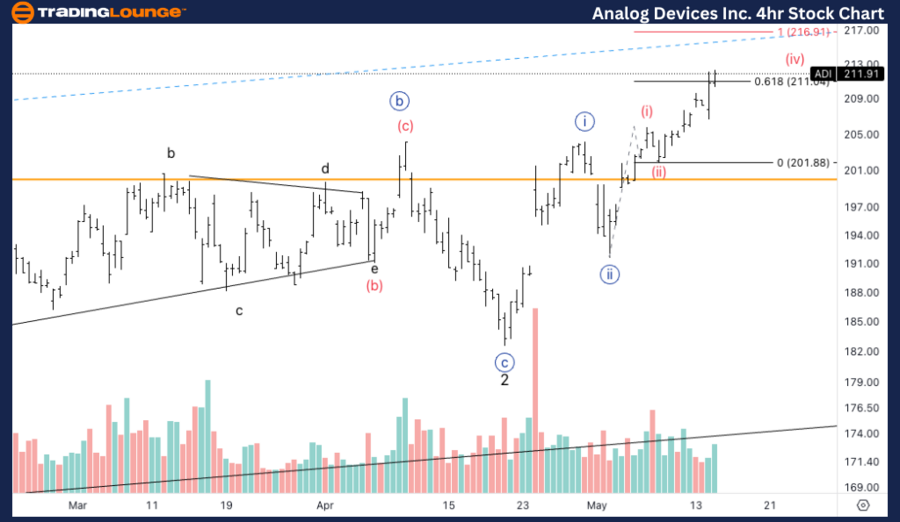
ADI Elliott Wave technical analysis
Function: Trend.
Mode: Impulsive.
Structure: Motive.
Position: Wave (iii) of {iii}.
Direction: Wave (iii).
Details: Volume suggests the bull trend is in place, looking for continuation higher.
ADI Elliott Wave technical analysis – Four-hour chart
The 4-hour chart complements the daily analysis by highlighting that ADI is in wave (iii) of Minute wave {iii}. The volume analysis suggests that the bullish trend is well-supported, indicating a likely continuation higher. This wave structure confirms the impulsive nature of the current market move, reinforcing the bullish outlook.
Analog Devices Inc. (ADI) is exhibiting a strong bullish trend according to the latest Elliott Wave analysis. Here’s a detailed breakdown of the current market scenario based on the daily and 4-hour charts.
Analog Devices Inc.(ADI) Elliott Wave technical analysis [Video]
Author

Peter Mathers
TradingLounge
Peter Mathers started actively trading in 1982. He began his career at Hoei and Shoin, a Japanese futures trading company.


