|

AMZN Elliott Wave technical analysis [Video]

AMZN Elliott Wave technical analysis

Function: Trend.

Mode: Impulsive.

Structure: Motive.

Position: Wave (v) of {i}.

Direction: Upside in (v).

Details: The market appears to be completing a five-wave sequence within wave {i}, with wave (v) currently unfolding. Wave (iii) previously extended, supporting ongoing upside potential in wave (v).

Chart

AMZN Elliott Wave Technical Analysis

Function: Trend.

Mode: Impulsive.

Structure: Motive.

Position: Wave (v) of {i}.

Direction: Upside in (v).

Details: With wave iii and wave i of (v) showing similar lengths, wave v could extend. This extension might drive price action toward the top of Minor Group 1, targeting $230.

Chart

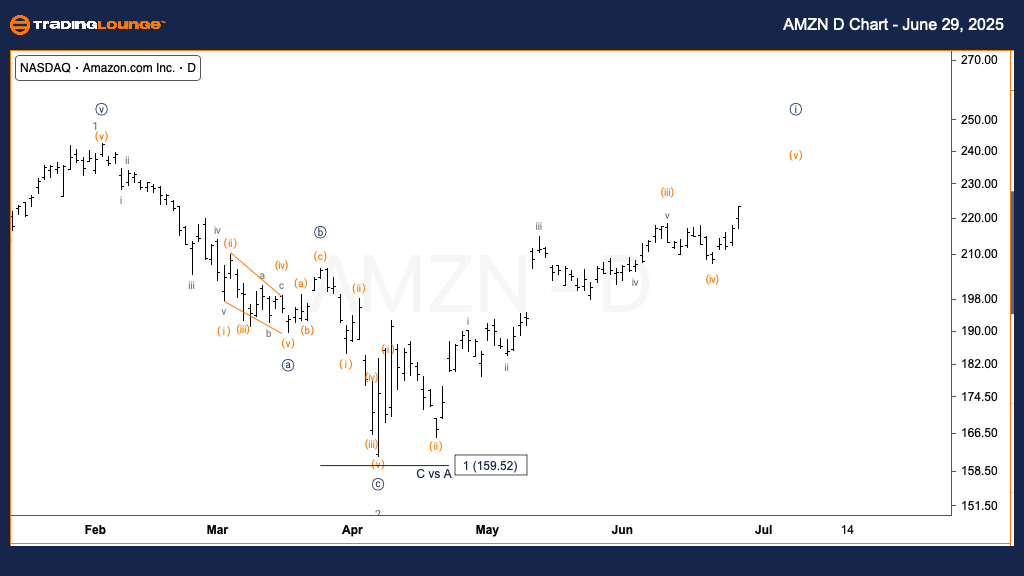
This analysis for Amazon.com Inc. (AMZN) covers both daily and 1-hour charts, utilizing Elliott Wave Theory to forecast market direction.

Daily chart overview:

AMZN is progressing through wave (v) of {i}, indicating the final phase of a five-wave pattern from April’s lows. With a previously extended wave (iii), wave (v) could either reach similar length or truncate. A corrective wave {ii} might follow upon completion.

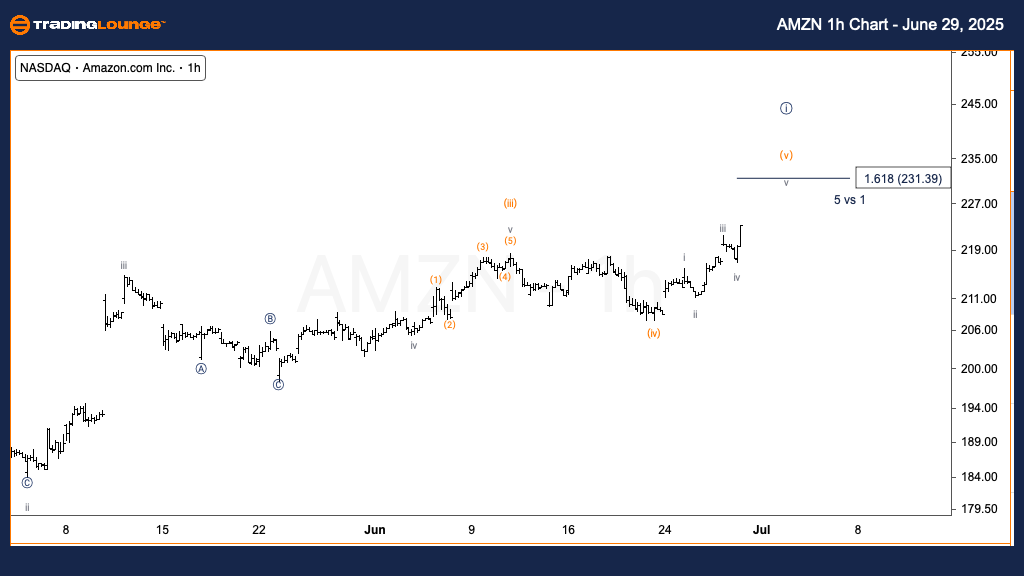
One-hour chart overview:

Wave (v) is developing with clear structure. The similarity in length between waves iii and i of (v) supports the likelihood of an extension in wave v. Price may reach the top of MinorGroup1, around $230, which aligns with Fibonacci projections in typical motive wave formations.

AMZN Elliott Wave technical analysis [Video]

Author

Peter Mathers

Peter Mathers

TradingLounge

Peter Mathers started actively trading in 1982. He began his career at Hoei and Shoin, a Japanese futures trading company.

More from Peter Mathers
Share:

Markets move fast. We move first.

Orange Juice Newsletter brings you expert driven insights - not headlines. Every day on your inbox.

By subscribing you agree to our Terms and conditions.

Editor's Picks

EUR/USD holds steady below 1.1800

EUR/USD moves sideways in a narrow channel below 1.1800 as the market volatility remains low ahead of the New Year holiday. On Tuesday, investors will pay close attention to the minutes of the Federal Reserve's December policy meeting.

GBP/USD retreats below 1.3500 as trading conditions remain thin

GBP/USD corrects lower after posting strong gains in the previous week and trades below 1.3500 on Monday. With the action in financial markets turning subdued following the Christmas holiday, however, the pair's losses remain limited.

Gold holds above $4,300 after setting yet another record high

Spot Gold traded as high as $4,550 a troy ounce on Monday, fueled by persistent US Dollar weakness and a dismal mood. The XAU/USD pair was hit sharply by profit-taking during US trading hours and retreated towards $4,300, where buyers reappeared.

Crypto market outlook for 2026

Year 2025 was volatile, as crypto often is.  Among positive catalysts were favourable regulatory changes in the U.S., rise of Digital Asset Treasuries (DAT), adoption of AI and tokenization of Real-World-Assets (RWA).

Economic outlook 2026-2027 in advanced countries: Solidity test

After a year marked by global economic resilience and ending on a note of optimism, 2026 looks promising and could be a year of solid economic performance. In our baseline scenario, we expect most of the supportive factors at work in 2025 to continue to play a role in 2026.

Crypto market outlook for 2026

Year 2025 was volatile, as crypto often is.  Among positive catalysts were favourable regulatory changes in the U.S., rise of Digital Asset Treasuries (DAT), adoption of AI and tokenization of Real-World-Assets (RWA).