|

AMD Elliott Wave technical analysis [Video]

AMD Elliott Wave technical overview

Function: Trend.

Mode: Impulsive.

Structure: Motive.

Position: Wave (v) of {iii}.

Direction: Potential Top in Wave (v).

Details: A possible top is forming in wave {iii} as price nears the Minor Group 2 zone at $180.

Chart

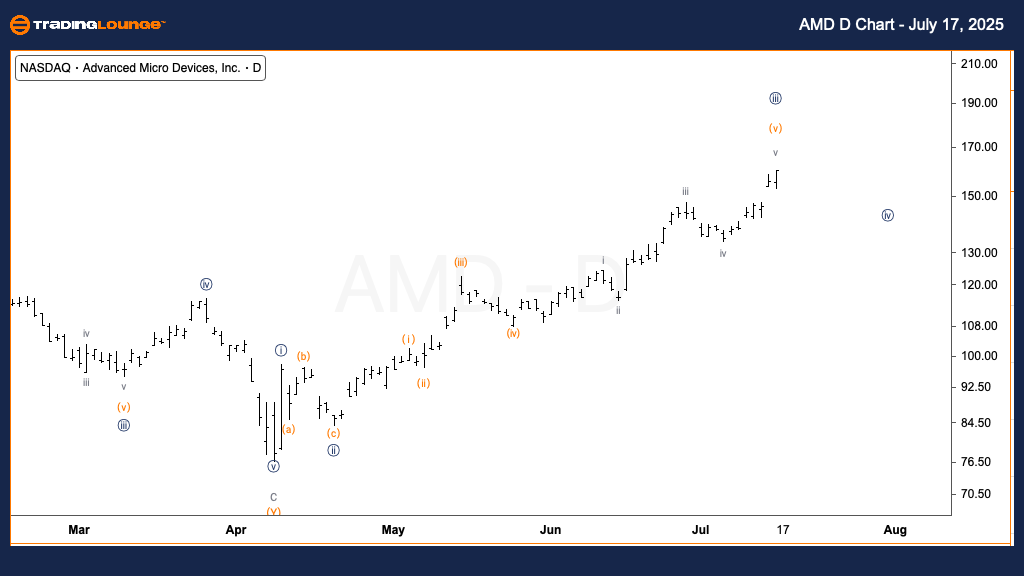
On the daily chart, Advanced Micro Devices Inc. (AMD) is in the late phase of an impulsive wave cycle, with wave (v) of {iii} progressing toward its potential conclusion. Price action is approaching the $180 level, which coincides with the anticipated end of Minor Group 2.

While the overall trend remains upward, this area may mark a near-term high. A break or reversal here would indicate the end of wave {iii}, setting the stage for wave {iv} to develop as a corrective pullback. Traders should monitor this level closely for signs of trend fatigue or reversal.

AMD Elliott Wave technical overview

Function: Trend.

Mode: Impulsive.

Structure: Motive.

Position: Wave (V) of {v}.

Direction: Possible Top in Wave (v).

Details: A conservative count suggests final movement in wave {v} of 1 is nearing completion.

Chart

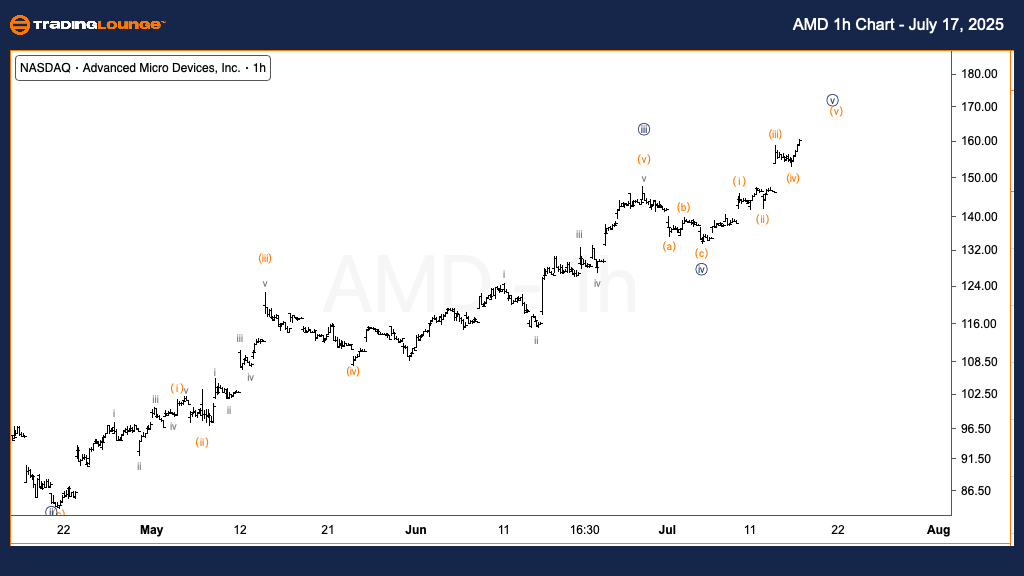
The 1-hour chart provides a shorter-term look at AMD’s wave structure. The stock is currently unfolding wave (V) of {v}, signaling the final push within wave {v} of 1. This structure implies a near-term top may be imminent.

The chart supports a conservative interpretation, where after this final wave concludes, a correction in wave 2 may begin. Price action near the $180 mark should be observed for potential reversal cues, offering an opportunity to prepare for the next wave sequence.

AMD Elliott Wave technical overview [Video]

Author

Peter Mathers

Peter Mathers

TradingLounge

Peter Mathers started actively trading in 1982. He began his career at Hoei and Shoin, a Japanese futures trading company.

More from Peter Mathers
Share:

Markets move fast. We move first.

Orange Juice Newsletter brings you expert driven insights - not headlines. Every day on your inbox.

By subscribing you agree to our Terms and conditions.

Editor's Picks

EUR/USD rebounds after falling toward 1.1700

EUR/USD gains traction and trades above 1.1730 in the American session, looking to end the week virtually unchanged. The bullish opening in Wall Street makes it difficult for the US Dollar to preserve its recovery momentum and helps the pair rebound heading into the weekend.

GBP/USD steadies below 1.3400 as traders assess BoE policy outlook

Following Thursday's volatile session, GBP/USD moves sideways below 1.3400 on Friday. Investors reassess the Bank of England's policy oıtlook after the MPC decided to cut the interest rate by 25 bps by a slim margin. Meanwhile, the improving risk mood helps the pair hold its ground.

Gold stays below $4,350, looks to post small weekly gains

Gold struggles to gather recovery momentum and stays below $4,350 in the second half of the day on Friday, as the benchmark 10-year US Treasury bond yield edges higher. Nevertheless, the precious metal remains on track to end the week with modest gains as markets gear up for the holiday season.

Crypto Today: Bitcoin, Ethereum, XRP rebound amid bearish market conditions

Bitcoin (BTC) is edging higher, trading above $88,000 at the time of writing on Monday. Altcoins, including Ethereum (ETH) and Ripple (XRP), are following in BTC’s footsteps, experiencing relief rebounds following a volatile week.

How much can one month of soft inflation change the Fed’s mind?

One month of softer inflation data is rarely enough to shift Federal Reserve policy on its own, but in a market highly sensitive to every data point, even a single reading can reshape expectations. November’s inflation report offered a welcome sign of cooling price pressures. 

XRP rebounds amid ETF inflows and declining retail demand demand

XRP rebounds as bulls target a short-term breakout above $2.00 on Friday. XRP ETFs record the highest inflow since December 8, signaling growing institutional appetite.