AMD bearish setup from blue box turns risk-free for sellers

Looking at the big picture, we saw that $AMD completed a long-term bullish cycle. This cycle began in July 2015 and ended in March 2024. According to Elliott Wave theory, a 3-wave correction usually follows a 5-wave advance. That is exactly what happened. After the March 2024 high, AMD stock prices began to fall. They started forming a double zigzag structure. However, the structure is still incomplete. Based on our projection, this pullback could extend to 81.84–57.06 in the coming months.
To refine this long-term forecast, we analyzed the daily, H4, and H1 charts for our members. In December 2024, the stock broke a major low within this corrective structure. This confirmed an incomplete bearish impulse sequence. Since the bearish sequence is clear, we prefer selling bounces in 3, 7, or 11 swing setups at the blue box.
AMD Elliott Wave chart – 01.07.2025 update
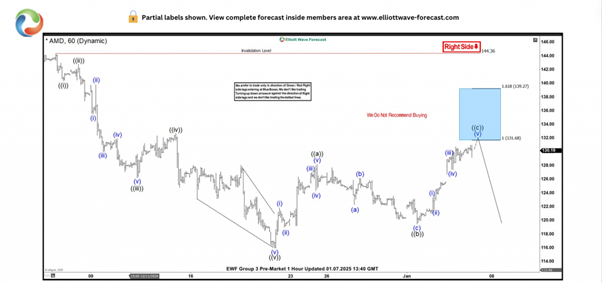
On January 7, 2025, we shared the 1-Hour chart with members. Wave 3 ended on December 20, followed by wave 4. We observed that wave 4 was forming a 3-swing (zigzag) structure. As usual, we measured the blue box for wave 4. At this level, we expected selling pressure to increase and push prices lower toward wave 5. Therefore, members prepared to sell AMD stocks at 131.68. They set a stop-loss slightly above 139.27 and aimed for a target of 112.2.
AMD Elliott Wave chart – 01.08.2025 update
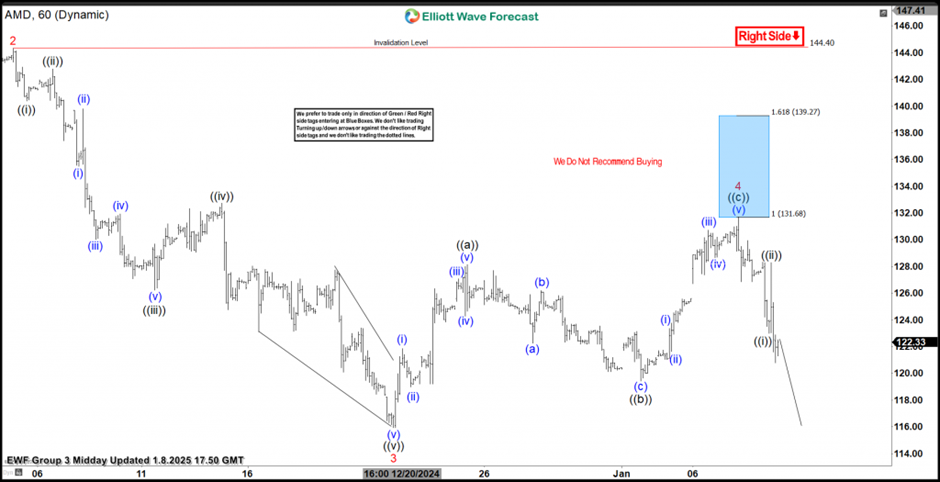
On the same day we shared the chart, the price hit the blue box. The next day, we updated members with a new chart. As shown, the price dropped immediately from the blue box and reached the risk-free area.
We advised members to close half of their position for profit. Then, we recommended adjusting the remaining position to breakeven. While we still expect the target to be reached, we are mindful of the market’s dynamic nature. For this reason, we decided to secure some profit.
AMD: What next?
The price is currently falling in wave 5 of (V). We cannot determine where wave 5 will end yet. However, it is highly likely to reach the target at 112.27.At that price or lower, AMD should complete wave (A), a 5-wave decline. According to the Elliott Wave principle, a 3- or 7-swing bounce should follow for wave (B).We plan to sell wave (B) at the blue box. Blue boxes are shown on the chart to help members identify where to buy or sell and set stops. This approach makes trading simple for them.
Author

Elliott Wave Forecast Team
ElliottWave-Forecast.com


