AMC entertainment will bring us more selling opportunities
AMC Entertainment Holdings, Inc. is an American movie theater chain headquartered in Leawood, Kansas, and the largest movie theater chain in the world. Founded in 1920, AMC has the largest share of the U.S. theater market ahead of Regal and Cinemark Theatres. It has 2,866 screens in 358 theatres in Europe and 7,967 screens in 620 theatres in the United States.
AMC ended a Grand Super Cycle in June 2021. In order to analyze the possible structure of Elliott we have transformed the chart to a logarithmic chart. The structure from the peak looks very clear, we have groups of bearish impulses connected by corrections. It is for this reason that a double correction structure is the best alternative for AMC’s decline. (If you want to learn more about Elliott Wave Theory, follow these links: Elliott Wave Education and Elliott Wave Theory)
AMC daily log chart December 2023
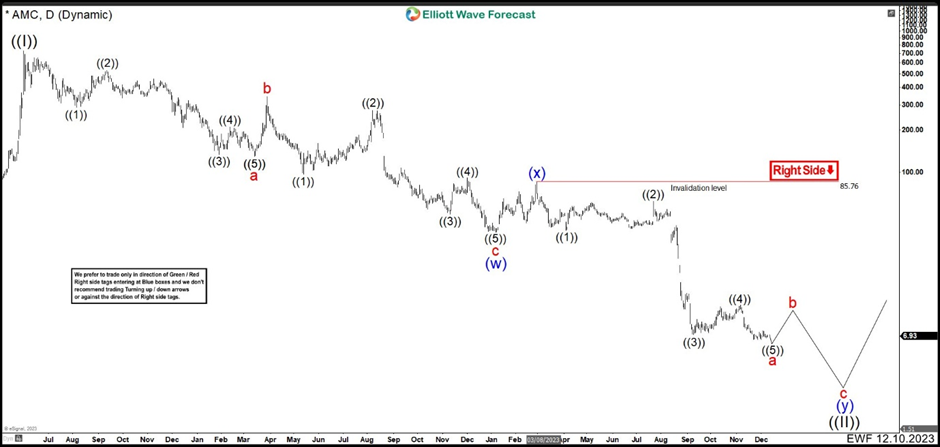
Down from the 2021 peak, we can see an impulse that finished wave “a” at 129.00 low. The correction of this cycle ended a wave “b” at 343.30 high and then continued a new downward impulse. This impulse completed wave “c” at 37.70 low, and thus, the first part of the double correction structure as (w). Then connector wave (x) was shallow ending at 85.30 high. Then the downward trend continued, having a strong bearish momentum in the month of August. We can clearly see another bearish impulse from the high of 85.30. However, the possible wave ((5)) has extended too much in the last months and the impulse has been damage. Therefore, the structure lower from wave (x) is better to call as a double correction.
AMC daily log chart March 2024
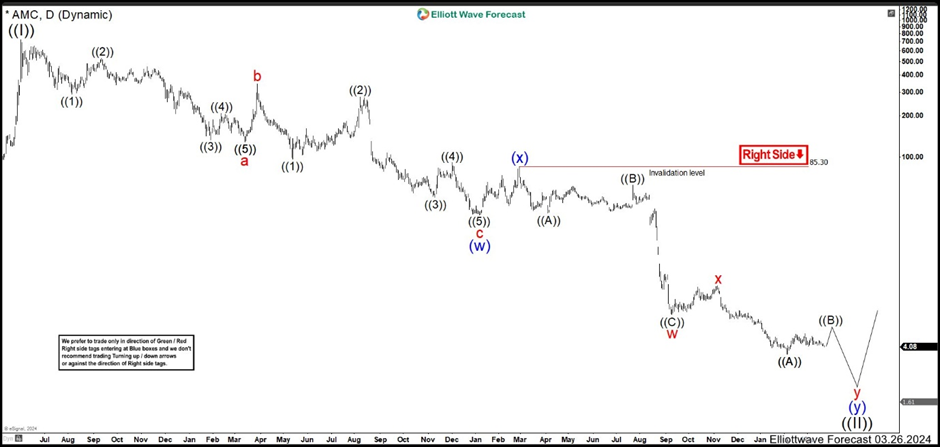
How you can see the forecast wave ((5)) has extend to much. You can think: “The structure is still an impulse,” but in this case not. If you check the RSI in daily timeframe, the RSI has erased divergence with a clear break. Therefore, that means there are 5 swings down from wave (x), but not an impulse rather these are part of a double correction. That is why we change the abc structure for a wxy structure. We can see 3 swings lower to end wave w at 7.05 low and wave x connector ended at 11.13 high. Now, we need 3 more swings lower complete the structure and the whole correction as wave ((II)). The first leg lower ended at 3.59 low as wave ((A)) and currently we are bulding wave ((B)) bounce. This wave ((B)) could end in 5.41 – 6.38 area, where AMC is going to give us a great opportunity to sell the market in wave ((C)) lower.
Author

Elliott Wave Forecast Team
ElliottWave-Forecast.com


