Amazon Inc.(AMZN) Elliott Wave technical analysis [Video]
![Amazon Inc.(AMZN) Elliott Wave technical analysis [Video]](https://editorial.fxstreet.com/images/Markets/Equities/Industries/Software/software-code-637435356353853480_XtraLarge.jpg)
AMZN Elliott Wave technical analysis
Function: Trend.
Mode: Impulsive.
Structure: Motive.
Position: Minor wave 1.
Direction: upside in wave {v} of 1.
Details: Looking for upside towards Trading Level 2 at 200$, as we have just hit previous ATH with yesterday’s session.
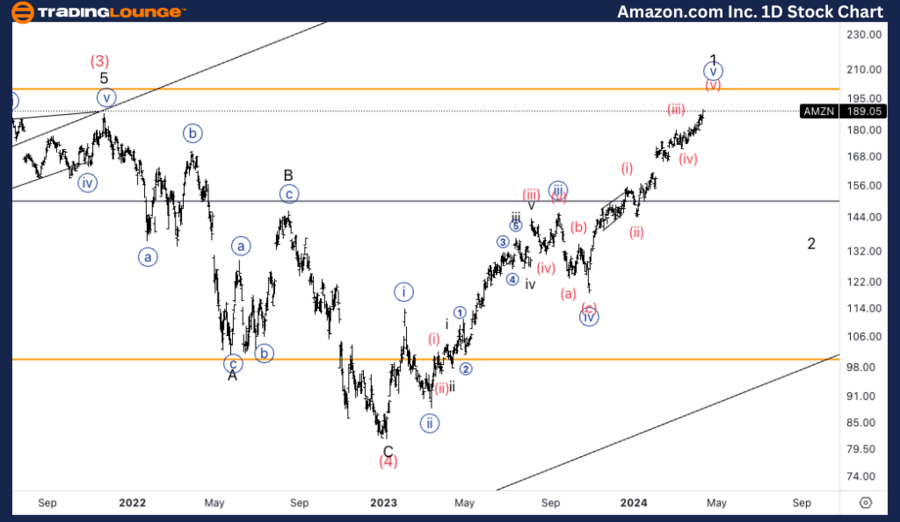
AMZN Elliott Wave technical analysis – Daily chart
On the Daily Chart, our analysis indicates a trending market characterized by impulsive mode and motive structure, positioned in Minor wave 1. The direction suggests upside momentum in wave {v} of 1. With yesterday's session hitting previous All-Time High (ATH), we anticipate further upside movement towards Trading Level 2 at $200.
AMZN Elliott Wave technical analysis
Function: Trend.
Mode: Impulsive.
Structure: Motive.
Position: Wave {v}.
Direction: Upside in wave (v) of {v}.
Details: Looking for upside into wave (v), the up move in (v) is not labelled as there are two main scenarios. The first one suggests we are extending with a series of ones and twos to then reach higher towards 200$. The other suggests we are moving upwards in a series of threes to form an ending diagonal.
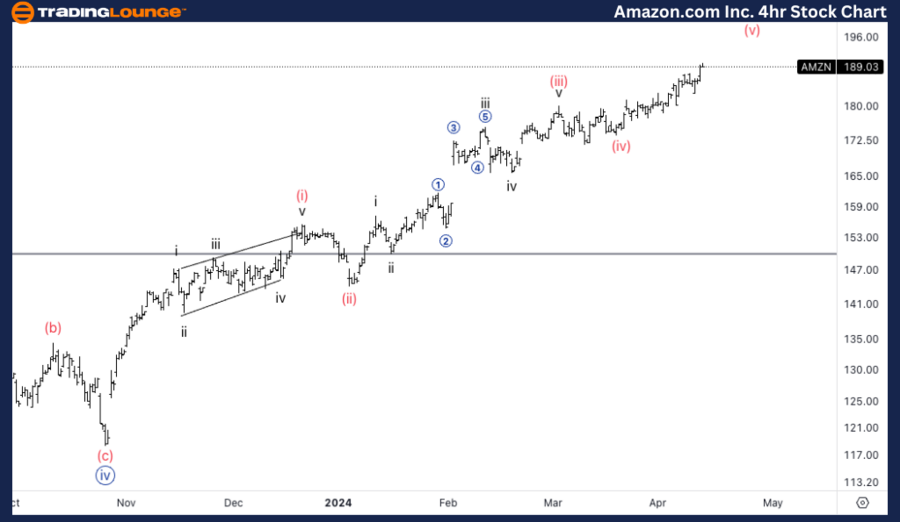
AMZN Elliott Wave technical analysis – Four-hour chart
Here, we observe a trending market marked by impulsive mode and motive structure, positioned in Wave {v}. The direction points to upside movement in wave (v) of {v}. However, the upmove in (v) is not specifically labelled due to two main scenarios. The first scenario suggests extension with a series of ones and twos, leading towards the $200 level. The second scenario proposes upward movement in a series of threes, potentially forming an ending diagonal.
AMZN Elliott Wave technical analysis [Video]
Author

Peter Mathers
TradingLounge
Peter Mathers started actively trading in 1982. He began his career at Hoei and Shoin, a Japanese futures trading company.


