Amazon Inc (AMZN) Elliott Wave technical analysis [Video]
![Amazon Inc (AMZN) Elliott Wave technical analysis [Video]](https://editorial.fxstreet.com/images/Markets/Equities/display-panel-of-daily-stock-market-59908972_XtraLarge.jpg)
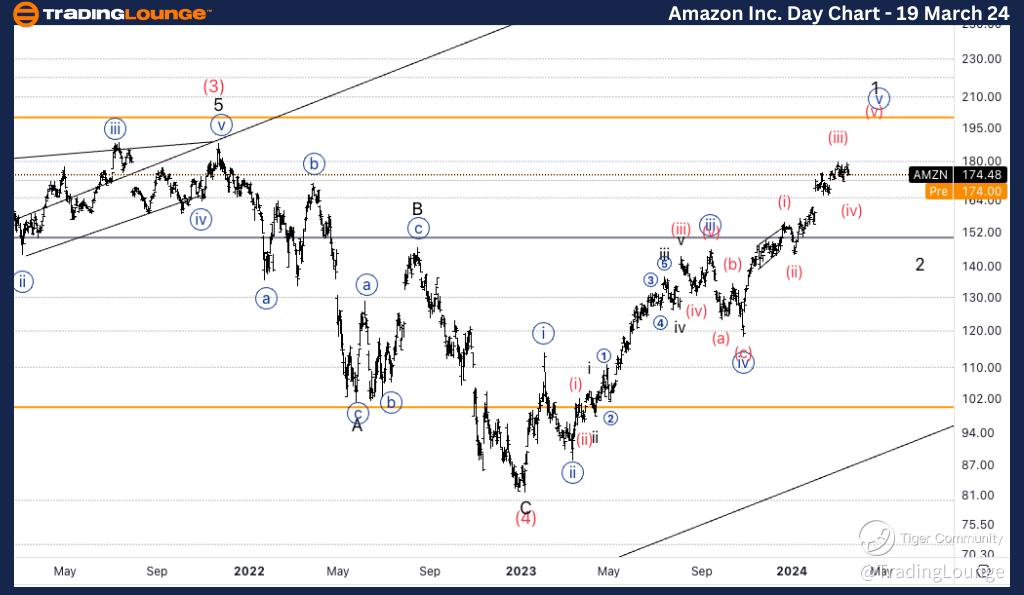
AMZN Elliott Wave analysis trading lounge daily chart, 19 March 24
Amazon.com Inc., (AMZN) Daily Chart.
AMZN Elliott Wave Technical Analysis.
Function: Trend.
Mode: Impulsive.
Structure: Motive.
Position: Intermediate wave (5).
Direction: Wave 1 of (5).
Details: As we are approaching ATH we are considering the move from the 80$ bottom to be part of wave (5). In the most bearish of scenarios you could argue this is not wave 1 of (5), but wave (5).
AMZN Elliott Wave technical analysis – Daily chart
Our analysis reveals a trending function characterized by impulsive mode and motive structure, positioned in Intermediate wave (5). The direction indicates Wave 1 of (5) as we near the all-time high (ATH). While some argue this could be wave (5) in the most bearish scenarios, we consider it as part of wave (5) from the $80 bottom.
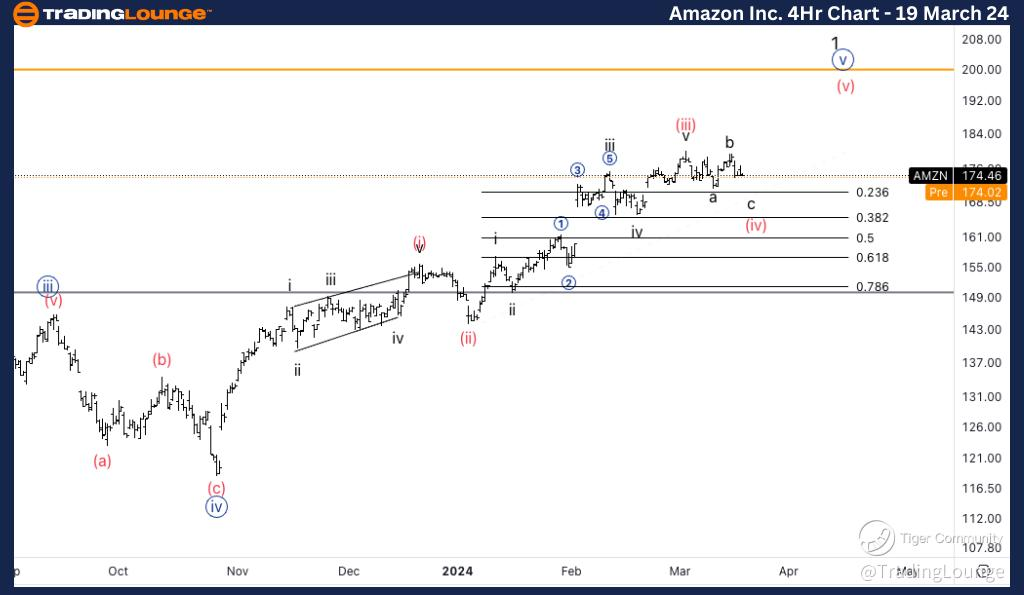
AMZN Elliott Wave analysis trading lounge four hour chart, 19 March 24
Amazon.com Inc., (AMZN) 4Hr Chart.
AMZN Elliott Wave Technical Analysis.
Function: Trend.
Mode: Impulsive.
Structure: Motive.
Position: Minor wave 1.
Direction: Minute wave {v} of 1.
Details: Looking for continuation lower into wave (iv) as we seem to be needing further downside. Looking for support around 38.2% fib retracement to then target TL2 at 200$.
Welcome to our AMZN Elliott Wave Analysis Trading Lounge, where we provide comprehensive insights into Amazon.com Inc. (AMZN) using Elliott Wave Technical Analysis. Let's delve into the market dynamics as of the Daily Chart on 19th March 24.
AMZN Elliott Wave technical analysis – Four hour chart
Here, we also identify a trending function marked by impulsive mode and motive structure, positioned in Minor wave 1. The direction suggests Minute wave {v} of 1. We anticipate a continuation lower into wave (iv), indicating a need for further downside. Our analysis targets support around the 38.2% Fibonacci retracement level, with TL2 at $200 as the next target.
AMZN Elliott Wave technical analysis [Video]
Author

Peter Mathers
TradingLounge
Peter Mathers started actively trading in 1982. He began his career at Hoei and Shoin, a Japanese futures trading company.


