Alphabet (GOOGL) Stock Deep Dive: SELL with a $75 price target as advertising cutbacks to hurt revenue

Welcome back to our deep dive series where we are focusing on Alphabet (GOOG/GOOGL) this time around. As ever we will do an in-depth look at the company, its background, history and its current business model. We will then use this information to formulate a top-down approach to our valuation. We will use a macro outlook with some sector focus before diving into a discounted cash flow (DCF) model. We will then combine that with a relative valuation of the sector as a whole. We will also account for how we expect the valuation ratios to perform during current cycles and try to predict future cycles. Finally, we will combine our price target with technical analysis to see how this fits in with the long-term chart for Alphabet.
Contents
- Company overview and history
- Wall Street consensus forecasts
- Key valuation rating metrics
- Peer value comparison
- Macroeconomic backdrop, market cycle and sector analysis
- Recent news and earnings
- Forecast and valuation
- Technical analysis
- Executive summary, recommendation and price target
GOOGL Stock: Company overview and history
The irony of using Google search to assist in researching this article shows just how powerful the brand and company have become in such a short space of time. I am sure we are no doubt all aware of Alphabet, but just in case some of you are die-hard Brave or Edge fans, here's a little teaser.
Alphabet operates a global business operating in mobile phones, search, cloud, YouTube, Fitbit and other associated services through the Google Play store and Google Services. Google was founded as recently as 1998 by Standford students Larry Page and Sergey Brinn. The origins go back a few years earlier, but the current guise can be said to be the launch of Google in 1998. The company enjoyed rapid growth during the early part of the millennium and eventually led to its 2004 IPO. Post-IPO the gains in the stock have been impressive and Google, or Alphabet as its parent company is now known, is one of the most valuable companies on earth with a current market cap of $1.4 trillion.
Alphabet trades on the Nasdaq under the ticker GOOGL and GOOG. This is where it can get confusing, so stay with me. When Google IPO'd in 2004 it created two classes of shares – A and B class. The class A stock was the IPO offer and traded under the ticker GOOGL. Larry Page and Sergey Brin were concerned about the dilution of ownership though, so a class B stock was created that carried 10 times the voting rights of the class A stock. Class A was part of the IPO to the public, but class B with ten times the voting rights was held by company insiders to maintain voting control.
This is where it gets confusing. Class C stock under the ticker GOOG was issued in 2014 as part of a share split. This again was likely done to keep control in the hands of the class B holders. At the moment, Alphabet trades on the Nasdaq under two tickers GOOGL and GOOG. Little difference between the two apart from voting rights. Basically, the B shares can outvote the A shares, thus maintaining control. The C shares keep this status quo, and GOOGL and GOOG trade more or less at the same price, so the market seems to care little about voting power, likely because it all vests with the B shares.
Also read: Tesla Stock Deep Dive: Price target at $400 on China headwinds, margin compression, lower deliveries
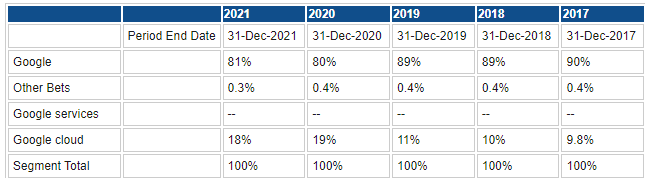
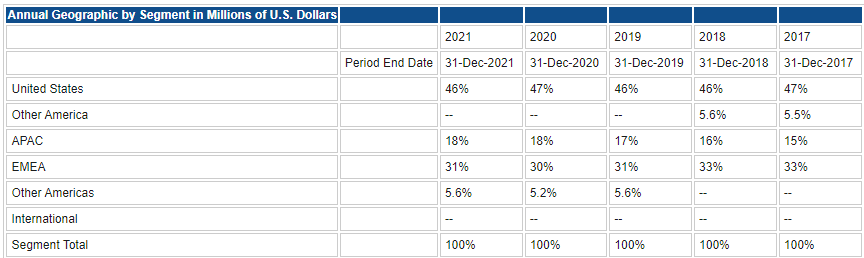
Alphabet generates the majority of its revenue from Google, which encompasses Youtube, search, advertising, etc. The cloud business is growing in line with the expansion in this area post-pandemic. Working from home increases the use of cloud technology as well. The second table shows the geographic mix of revenue generation with the USA at nearly 50%. Given the increasing strength of the US Dollar, the amount of revenue from the EU and Asia is significant given the respective weakness of the euro and yen among other forex headwinds. This trend in USD appreciation will hit next quarter's earnings as the dollar remains on its upward trend.
Source: Refinitiv
Source: Refinitiv
Year-to-date performance for Alphabet (GOOGL) has been poor, but as the chart below demonstrates it is merely moving in line with the Nasdaq. The S&P 500 has slightly outperformed. Year to date Alphabet is down 25%.
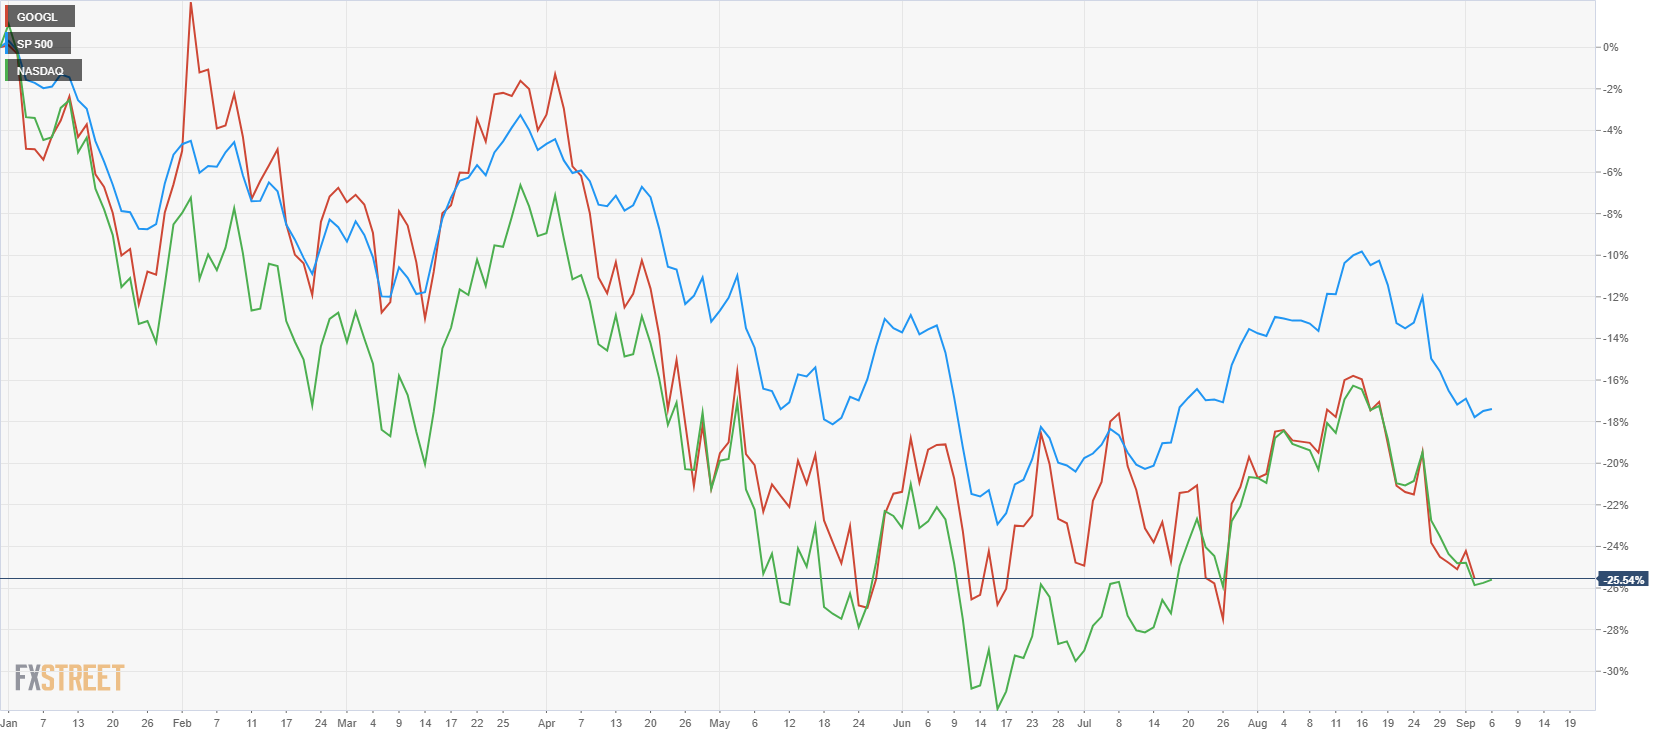
GOOGL daily versus S&P 500 and Nasdaq
Even if we go back five years to 2017, there is little alpha here. The Nasdaq and Googl moving in tandem, both showing strong gains obviously. The S&P 500 (blue) is the laggard.
-637980621097675841.png)
Googl versus Nasdaq and S&P 500 weekly to 2017
GOOGL Stock: Wall Street consensus forecasts
Source: Refinitiv
We can see how the analyst community has reacted to the falling share price, basically by following it lower. If the share price were to rise, they will follow it higher. Again not much alpha here. Analysts have already been marking down revenue and EPS forecasts for next quarter, and have taken them down by over 4% on an EPS level.
EPS estimates. Source: Refinitiv
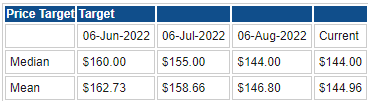
Despite this, the median price target remains a whopping 40% above at $144, with current prices at $108. It is unusual to see Wall Street analysts with sell ratings or price targets below the current market price. Markets are bullish about 80% of the time, so perhaps there is something to their optimism.
Key valuation rating metrics
Market cap: $1.4 trillion
Enterprise value: $1.35 billion
Free float: 5.92 billion
IPO date: 19th August 2004
52-week high: $151.5466
52-week low: $101.8847
Short interest: 0.80%
YTD performance: -25.50%
Source: Refinitiv and Tradingview
Peer value comparison
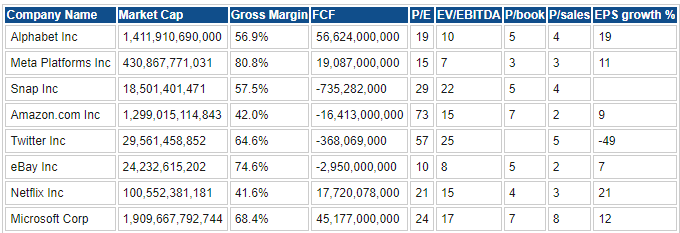
Source: Refinitiv
Macroeconomic backdrop, market cycle and sector analysis
The backdrop of rising inflation, interest rates and a likely recession continues to hurt equity valuations as 2022 progresses. It seems unlikely this situation will be reversed any time soon. However, we must remind ourselves that equities are forward discounting, and so equity market bottoms are usually well in advance of economic bottoms.
What is the more important metric in our view is how quickly, if at all, can the global economy recover in 2023 and what the path of interest rates will be. Interest rates are one of the most important metrics in equity valuation. They inform the equity risk premium as well as the discounting of future cash flows. The higher interest rates go, then the greater the discount, so the lower becomes equity valuations. Higher interest rates also discourage consumption and encourage saving, further slowing the business cycle. Finally, higher interest rates will necessitate higher equity risk premiums. The equity risk premium is the increased return an equity investor expects over the risk-free rate. The risk-free rate is usually the yield on US government bonds or equivalents.
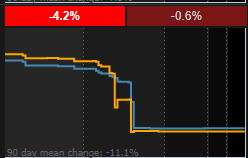
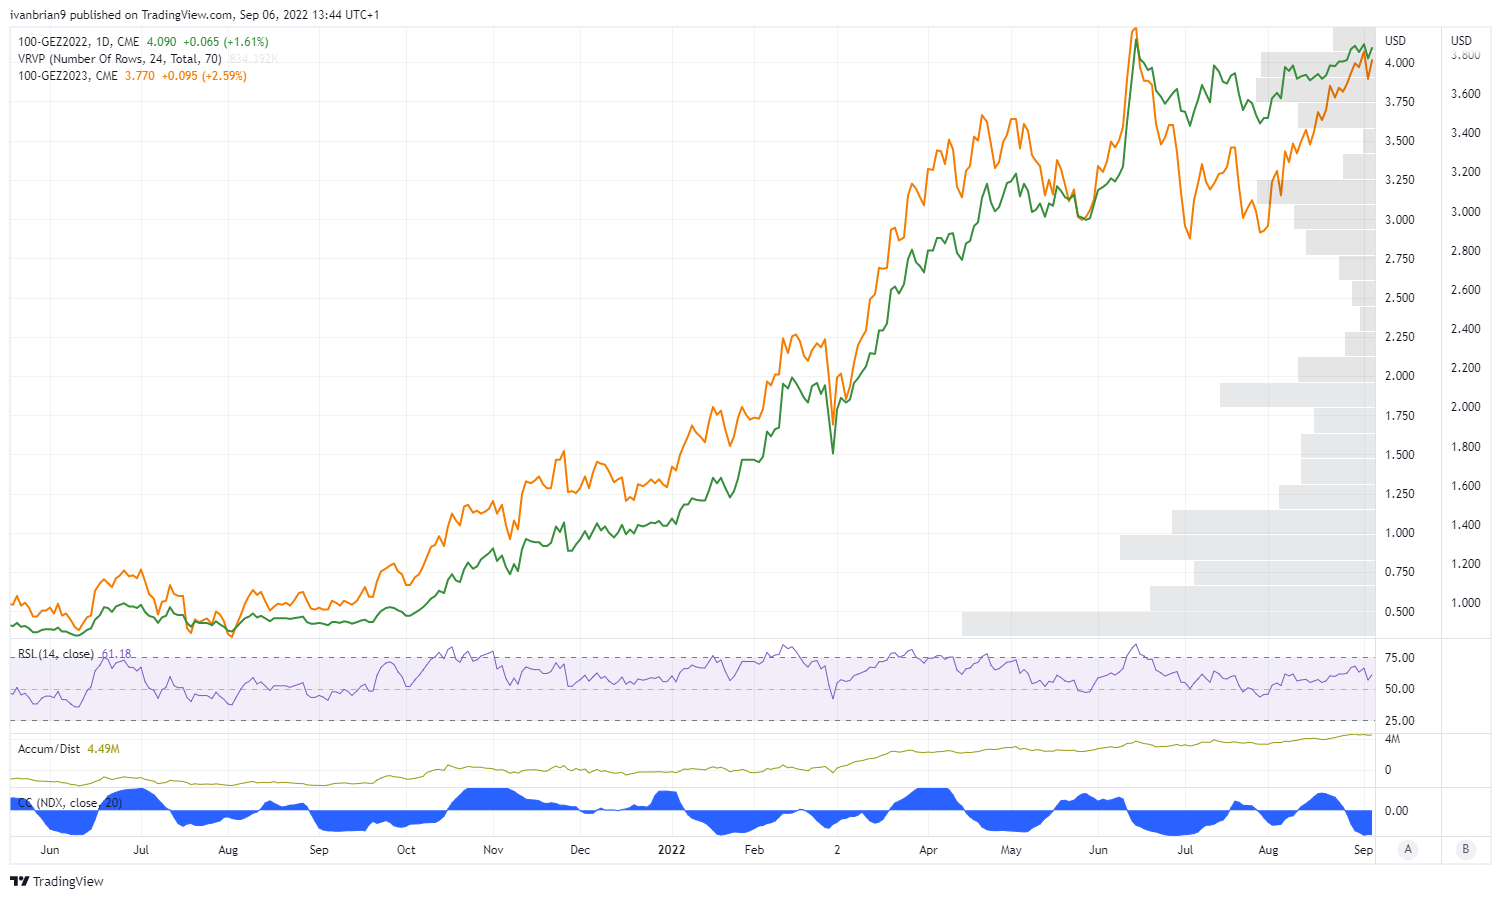
The bond and equity market had initially been pricing in a pretty sharp pivot by the Fed in the first half of 2023. This was based on the assumption the US would enter a recession and inflation would stabilize. The US has entered a recession, but inflation is stabilizing at high levels. This has meant that now the eurodollar futures market is only predicting a cut of 20 basis points in interest rates in 2023. Below we plot the eurodollar futures for December 2022 and December 2023. The market is predicting 4% for year-end and 3.8% by the end of 2023.
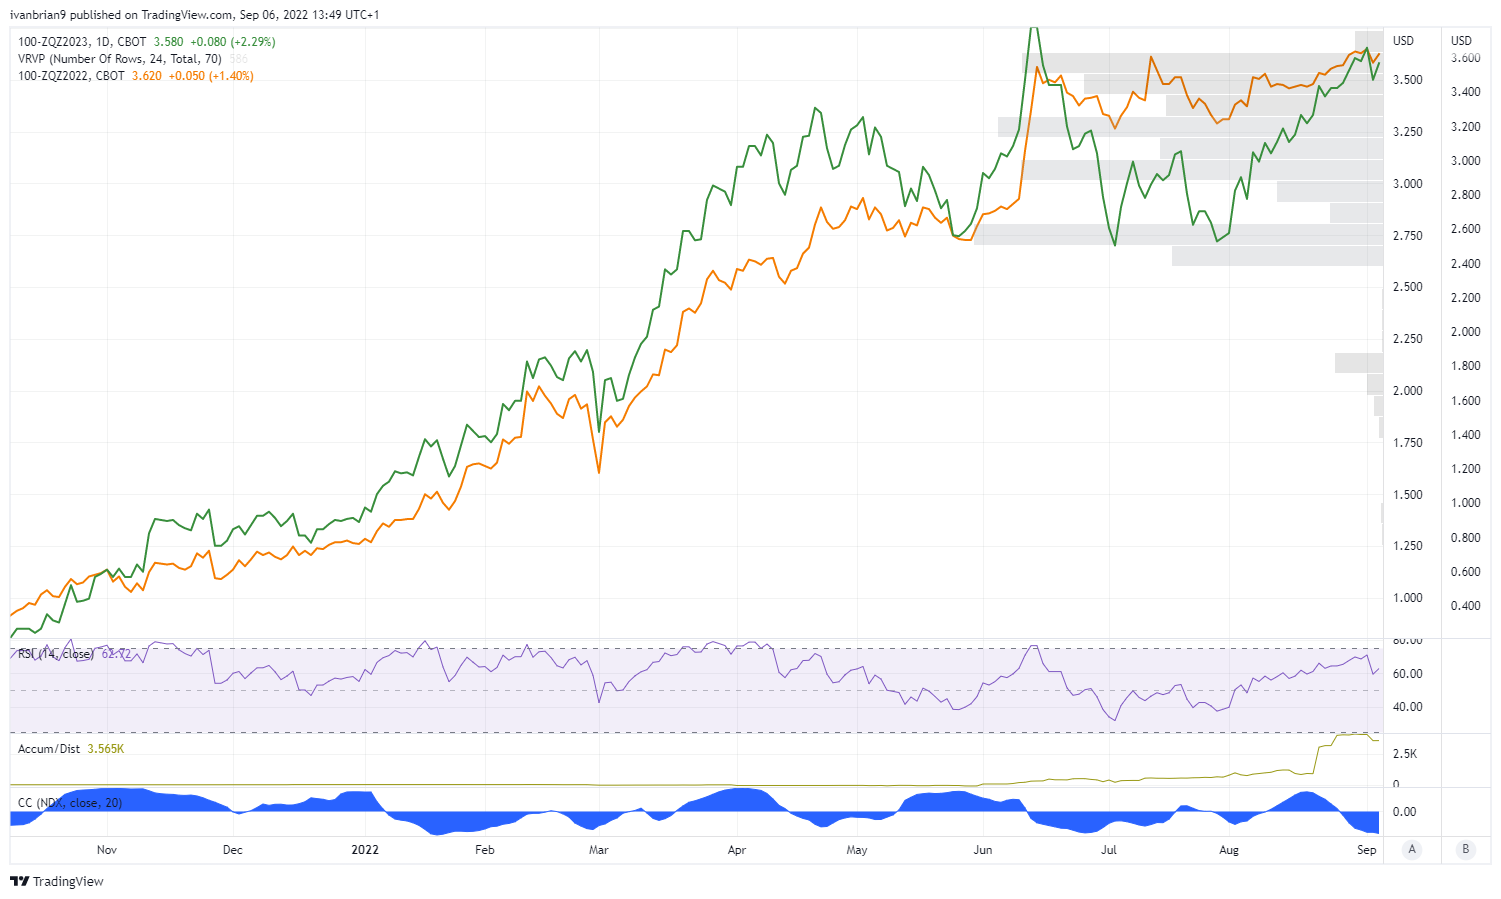
If we use 30-day fed funds futures, the situation is even more pronounced: 3.58% by the end of 2023 versus 3.62% in end of 2022. This prices in only 4 basis points of rate cuts in 2023.
Higher inflation and so higher interest rates for longer will likely see this bear market continue for at least the remainder of 2022 and into summer 2023. So what does that do to equity valuations?
"Just 53% of S&P 500 companies had sales growth that cleared inflation; the most crowded, growth-y sectors (Comm. Svcs. and Tech) sported negative real sales growth." - BofA pic.twitter.com/YcbnlJn8cG
— Sam Ro (@SamRo) August 15, 2022
— JE$US (@WallStJesus) August 29, 2022
Morgan Stanley sees significant earnings deterioration ahead, and tech has seen negative real sales growth already. The forward P/E of the S&P 500 is close to its 10-year average, but that 10-year average has been juiced by massive money printing. Look below at the inflation-adjusted CAPE or Shiller P/E, and the picture is not so rosy.
When CAPE is high, expected future returns are low.
— Alpha Connoisseur (@Asymmetry2195) August 30, 2022
Two reasons:
1. Low yield - High CAPE = low dividend yield = reduces total return.
2.Mean reversion - High CAPE eventually reverts back to its long-term average = share prices drop. pic.twitter.com/vfrMOiuZxs
It is also worth noting the massive differential in P/E ratios between the 20th and 80th percentile. It is the width of the channel. The last time it was this wide was at the time of the DotCom crash. We are still carrying too many grossly overvalued companies.
The median stock in the S&P 500 has a P/E of 16.2.
— Mike Zaccardi, CFA, CMT (@MikeZaccardi) September 3, 2022
25yr avg: 16.0 pic.twitter.com/APY3jMCl5O
S&P 500 not as cheap as it looks, Forward P/E is just about at the 10 year average pic.twitter.com/IgeTUxLdyD
— Bill Boynton (@wjboynton) September 3, 2022
All the metrics assume the E in P/E remains constant, but this is not the case. Analyst estimates are being repeatedly downgraded following last quarter earnings. For the P/E to remain constant, P needs to also fall.
Also read: Apple Stock Deep Dive: AAPL price target at $100 on falling 2023 revenues
Recent Alphabet (GOOGL) news and earnings
As we can see from the charts below, the picture is one of flatlining revenue and declining income. Not a great mix. As mentioned above analysts have already been cutting next quarter's EPS estimates in the wake of recent results. The sector as a whole has been struggling with Snap (SNAP) and Meta Platforms (META) also seeing sharp declines in earnings. A large part of tech companies' business models are overly reliant on advertising. We may all have assumed they were revolutionary tech firms, but most of their revenues were plain old-fashioned advertising.
Advertising spending falls sharply in a recession as companies pull back. Add in chronic cost issues in Europe, and the pullback from advertising spending will be even sharper. The latest reports from the UK say that up to 60% of companies could go bankrupt this winter in the face of huge energy bills. That is a huge number and means less advertising spending, so this trend is starting, not ending. Earnings going forward will be affected. Alphabet gets a reported 80% of its revenues from advertising. This is a surprisingly high number but one widely quoted in mainstream media.
Revenue is flatlining.
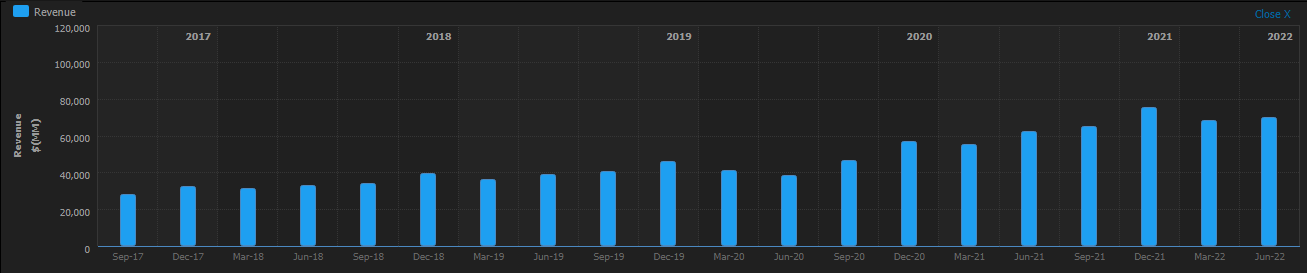
Source Refinitiv
Operating income is declining.
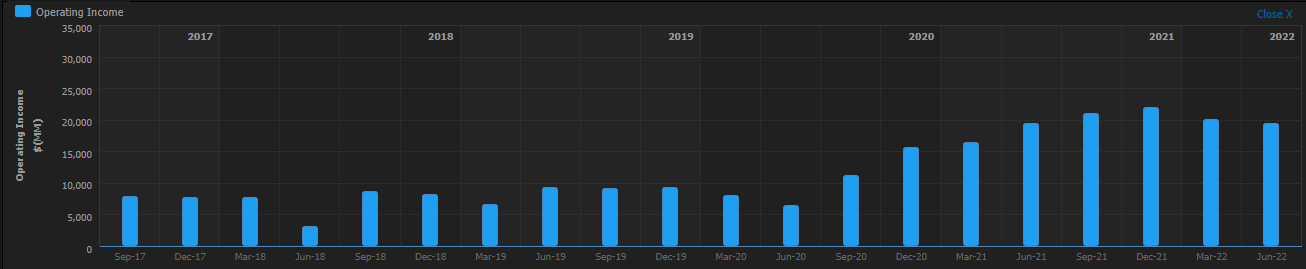
Source: Refinitiv
Also read: Citi Stock Deep Dive: Earnings, Buffet factor support our BUY rating and $60 price target
Alphabet forecast and valuation
We outline our two valuation models and how we have tweaked them to forecast what we see as declining growth rates and margin compression. As mentioned Alphabet (GOOGL) is overly reliant on advertising, and this revenue line will be hit by dual factors. First, there will be a reduction in ad spending. Second, expect a conversion problem due to dollar strength. We expect margin compression to further hit the valuation as inflation remains elevated.
Using a discounted cash flow (DCF) analysis, we come up with a fair value price of $76.86. This rises to $78.16 if we take into account the share buyback program, which will gradually reduce the number of shares. This is a forward-looking exercise, but the norm in discounting to PV would be to use the current share count. As markets are forward-looking though, we have included it for reference. In producing these numbers, we have reduced 2023 and 2024 revenue forecasts to merely account for the rate of inflation. We do not see incremental revenue growth and in fact find these revenue forecasts uncomfortably high based on what we see happening in the real world.
Alphabet (GOOGL) is exposed to small-medium businesses who advertise on Maps, search, etc. This is the sector in Europe that will be hit the hardest by a coming recession. Calling for revenue growth to remain flat looks optimistic in my view but still produces a bearish outlook on DCF analysis. We have also increased the tax rate as the impact of global tax increases comes to bear.
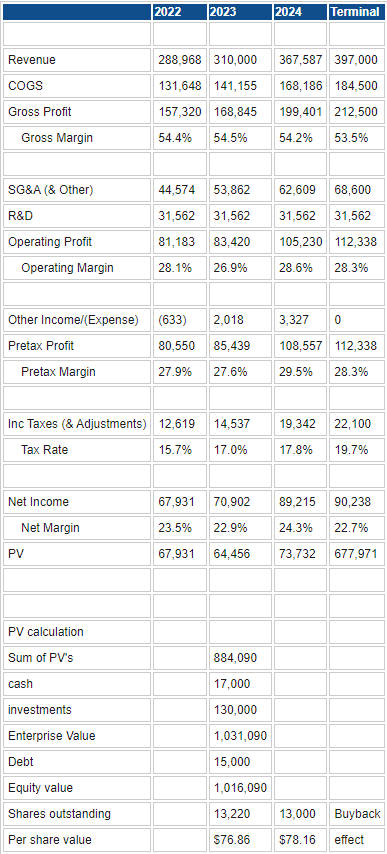
Source: Refinitive, FXStreet calculations
Taking next a relative valuation approach, again we make similar assumptions for revenue and taxation and then outline our EPS estimates. These can then be used to plot various valuation multiples on Alphabet (GOOGL) stock for peer comparison.
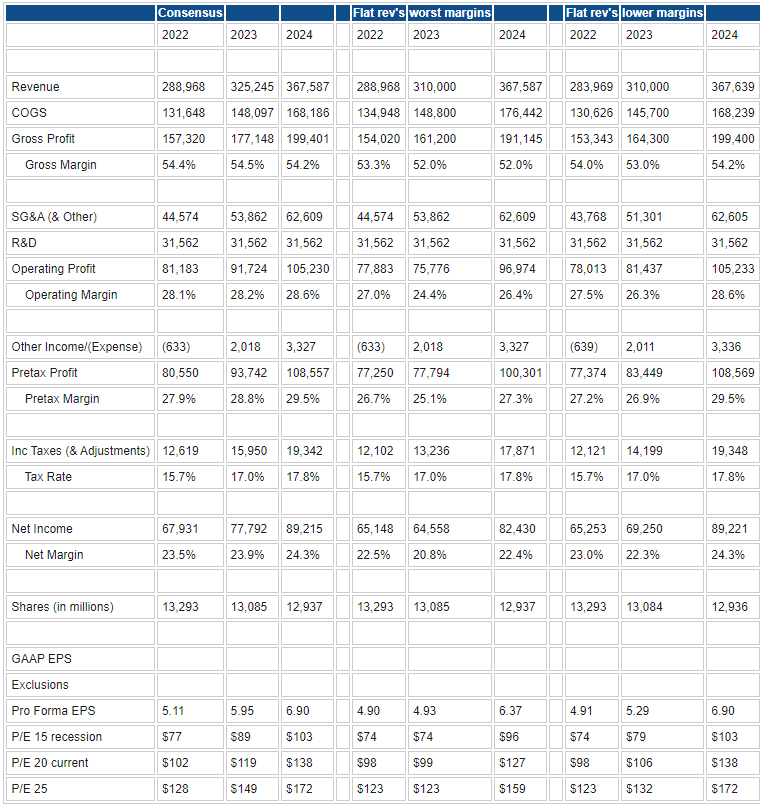
Source: Refinitive, FXStreet calculations
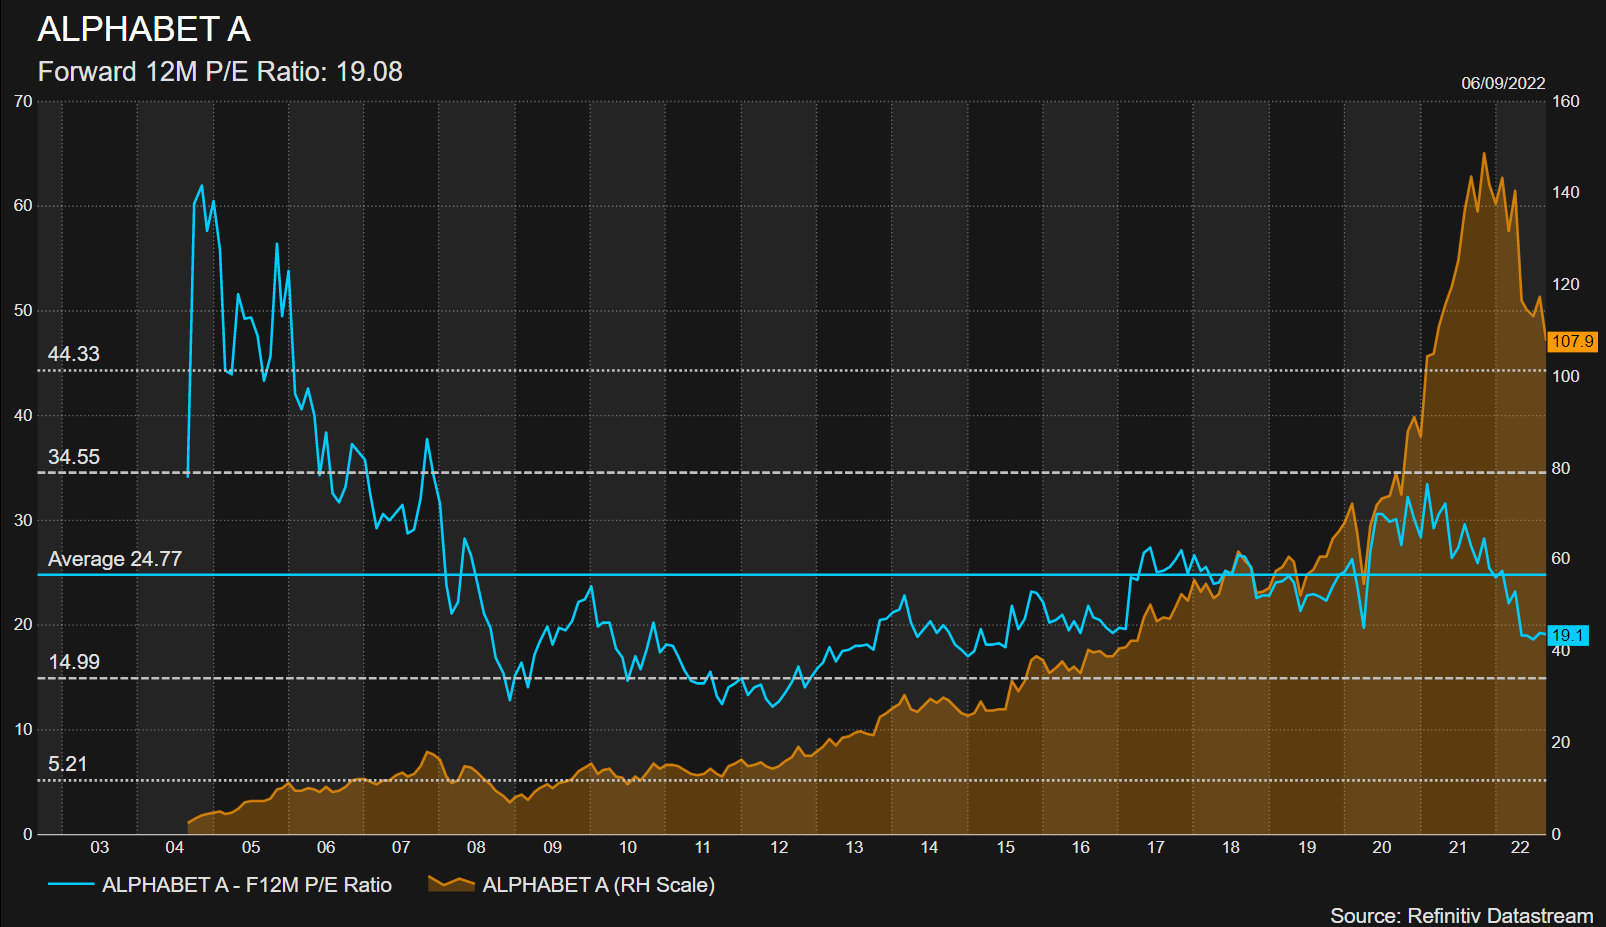
Ok, there is a lot of information in this table. Basically, I have outlined three different scenarios with regard to revenues and margins. This gives us an EPS outcome that we can then multiply by differing P/E ratios depending on where we are in the cycle. Alphabet does not have a lot of history, given it is such a new company. Going back to the Great Financial Crisis, its P/E rarely fell lower than 15 as we can see from the chart below. 15 is then our worst-case P/E ratio, 20 is current and 25 is optimistic. We have a various suite of outcomes, but overall there is more downside than upside here. My assumption is advertising revenue will fall further, so I tend to lean toward the worst-case outcome. That gives a price target of $74, in line with our DCF analysis above.
Also read: Walmart Deep Dive Analysis: Hold WMT to play defense vs upcoming US recession
Alphabet Technical analysis
The lure of $100 will be difficult to avoid for market participants. We can see the strong support at $105, which has held the bottom since May. If that goes, then expect a quick move to $100 and likely below as stops and psychological selling emerges. Ultimately, a return to pre-pandemic highs at $76 look likely. This again fits in with our DCF and relative valuation models above. Breaking $120 is needed to construct a bullish argument.
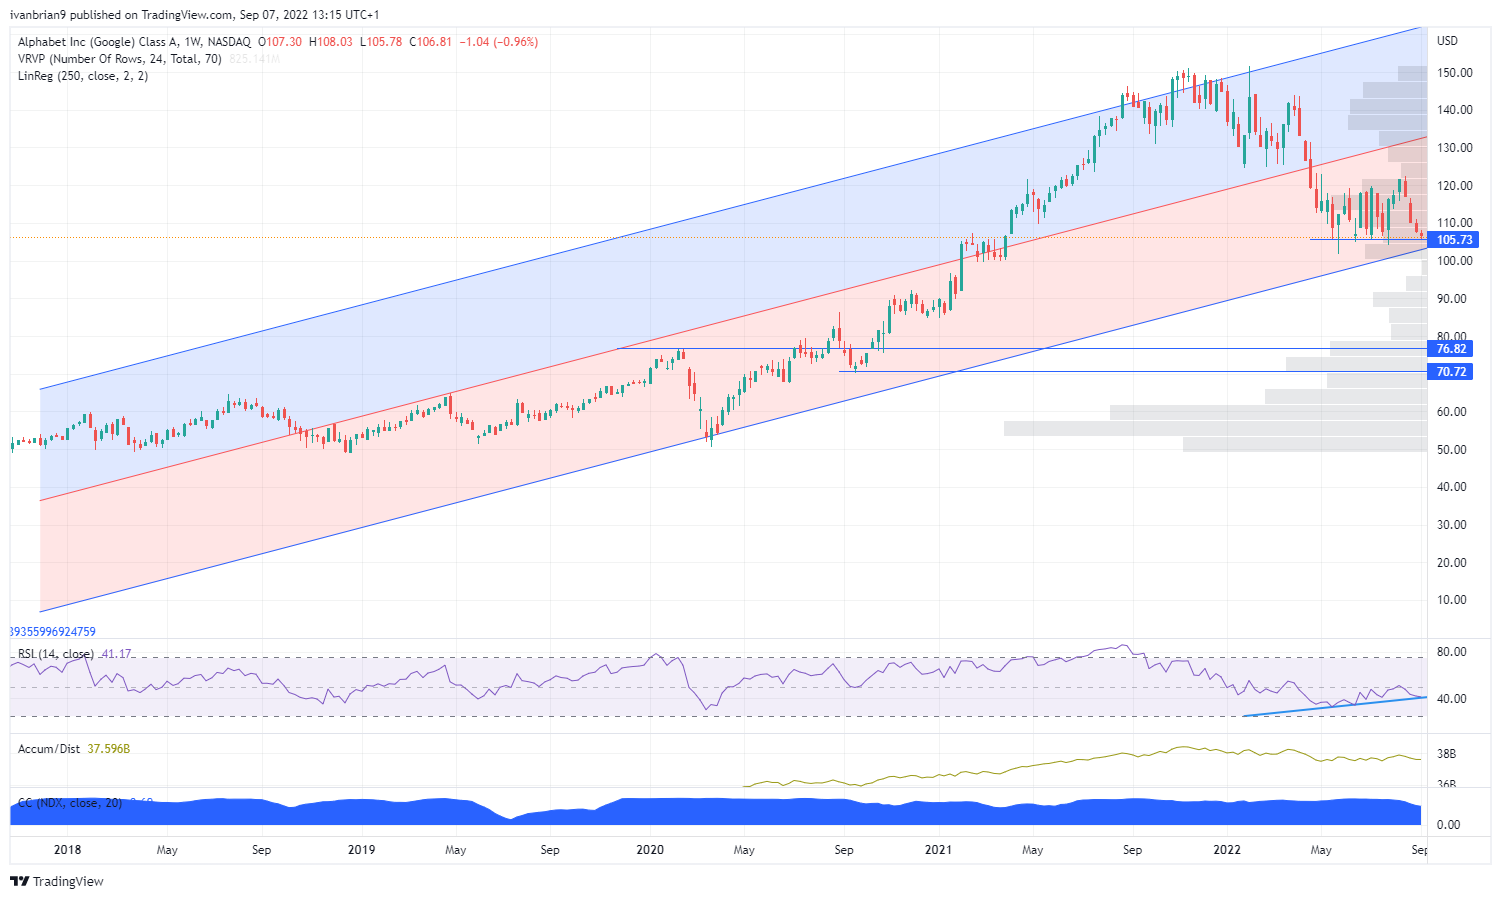
Alphabet (GOOGL) weekly
Executive Summary: price target and recommendation
We are, therefore, running with a 12-month price target of $75 for Alphabet (GOOGL) stock. This necessitates a SELL rating.
Our biggest caveat here is a Fed pivot. The standard in price target formulation is for 12 months, but in this time frame there is the possibility of a Fed pivot that could juice equities higher once more. However, I believe the Fed will only pivot if things get much worse economically, and so it may not have as dramatic an effect. Advertising is not the place to be in a recession, and Alphabet is too exposed to this sector in my view.
Upside risks
Fed pivot
European economy somehow avoids a deep recession
USD falls
Downside risks
Advertising spending drops more than forecast (I view this as likely)
Also read: Three dividend stocks that look interesting for the long run: BHP, MRNA, BTI
Author

Ivan Brian
FXStreet
Ivan Brian started his career with AIB Bank in corporate finance and then worked for seven years at Baxter. He started as a macro analyst before becoming Head of Research and then CFO.


